Question 1
Refer to the information provided in Figure 26.3 below to answer the question(s) that follow.


Refer to Figure 26.3. A shift from
AS
1 to
AS
0 represents a(n)
◦ increase in aggregate supply.
◦ decrease in aggregate supply.
◦ increase in aggregate quantity supplied.
◦ decrease in aggregate quantity supplied.
Question 2
Refer to the information provided in Figure 26.3 below to answer the question(s) that follow.
Refer to Figure 26.3. Following the recession of 2008-2009, many firms in the United States eventually began investing in new capital. This increase in investment in new capital would cause
◦ the short-run aggregate supply curve to shift from
AS1 to
AS0.
◦ the short-run aggregate supply curve to shift from
AS1 to
AS2.
◦ the economy to move from Point
B to Point
A along
AS1.
◦ the economy to move from Point
C to Point
B along
AS1.

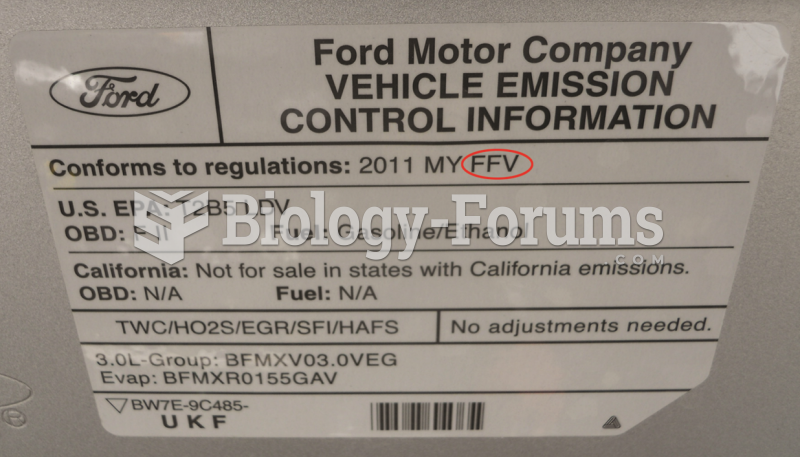 A vehicle emission control information (VECI) sticker on a flexible fuel vehicle.
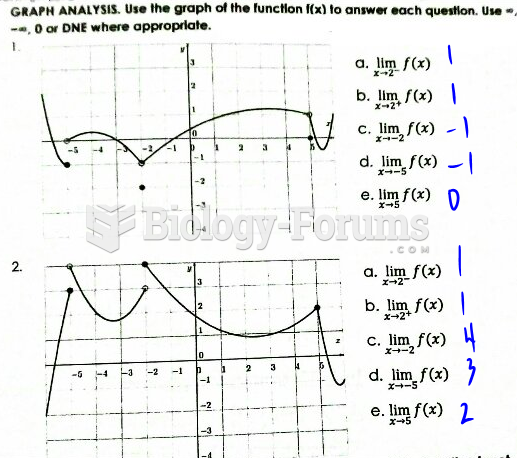 Use the graph of the function f(x) to answer each question.
 this is a math question
 economic question
 economic question
 economic question (having trouble)