This topic contains a solution. Click here to go to the answer
|
|
|

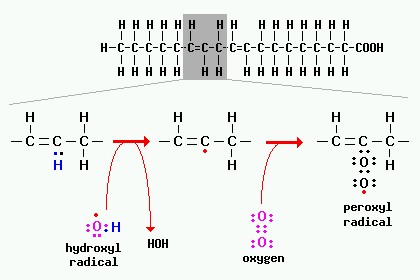 A peroxidation reaction involving a fatty acid is depicted in the figure below.
 How to solve a half life problem involving exponential models (Question 1)
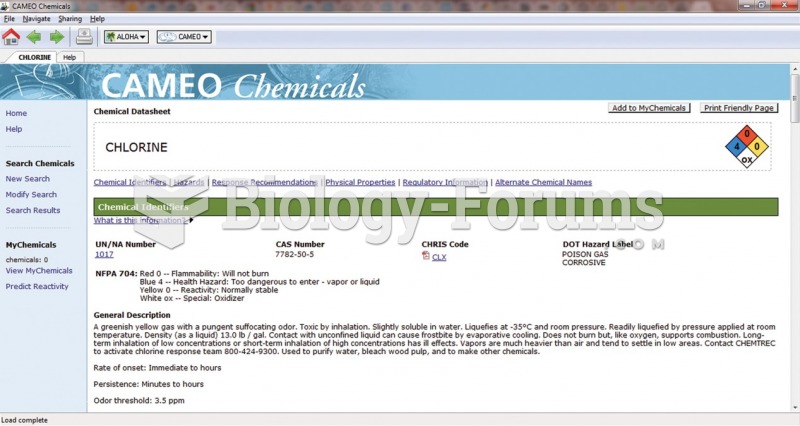 The CAMEO entry for chlorine. Useful information includes chemical and physical properties, personal ...
 Calc homework question
 economic question (having trouble)
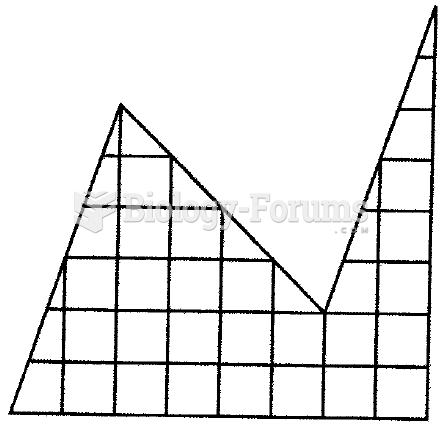 Cut the figure into two identical parts