This topic contains a solution. Click here to go to the answer
|
|
|

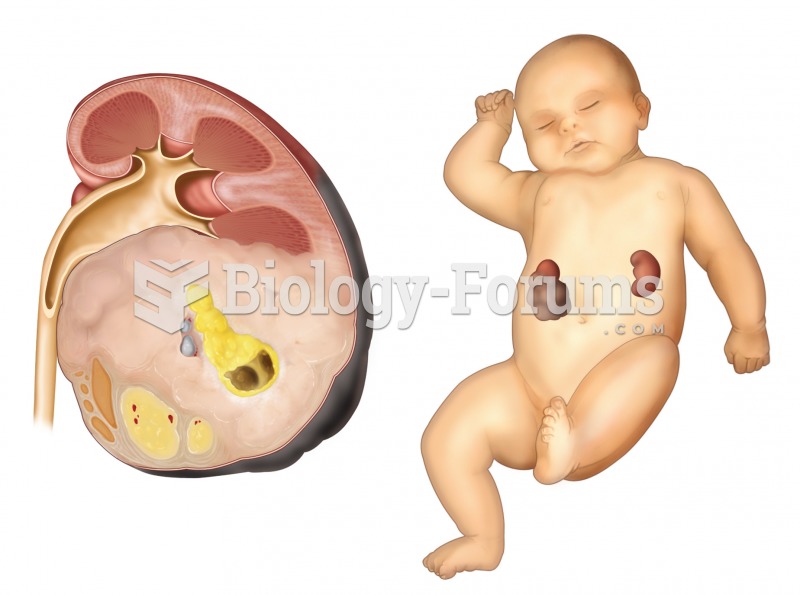 Nephroblastoma. A sectioned kidney reveals the presence of a very large tumor, which arose from feta
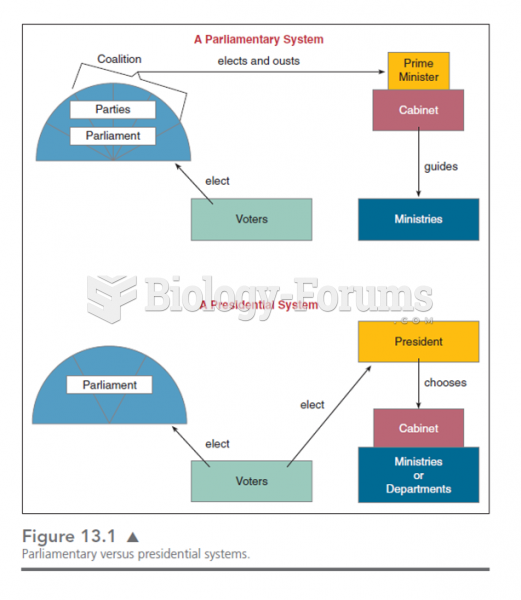 This chart shows the various lines of responsibility and how they differ in presidential and parliam
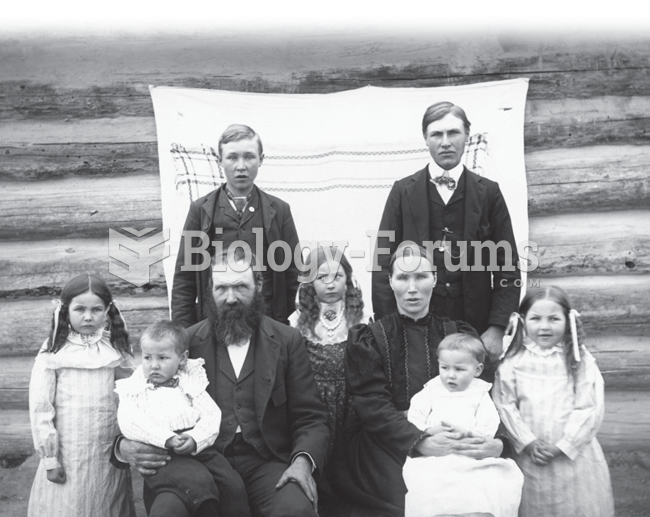 Large families on U.S. farms used to be common. Children helped plant and harvest crops, take care ...
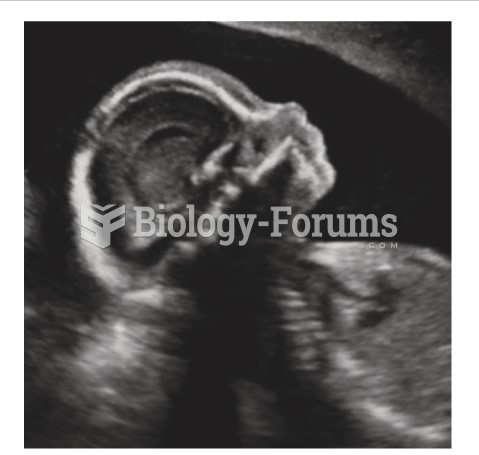 This image shows a normal third-trimester fetal brain
 As shown in the figure, a large open tank contains a layer of oil ( density 450 kg/m3) floating ...
 A bank statement shows a balance of $2,970.31 The check register of the account owner shows an ...