This topic contains a solution. Click here to go to the answer
|
|
|

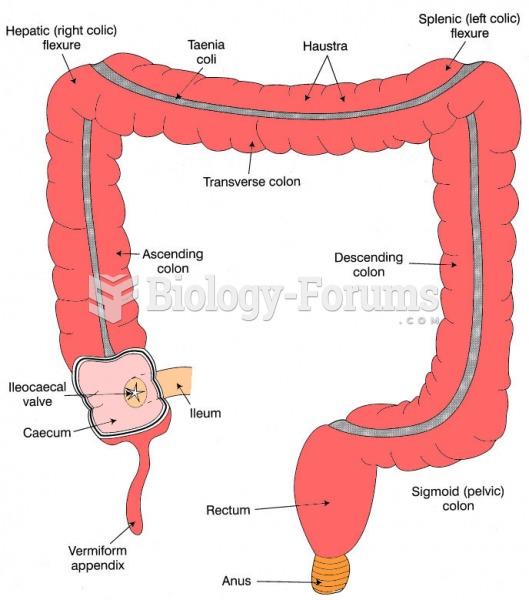 Anatomy of the large intestine
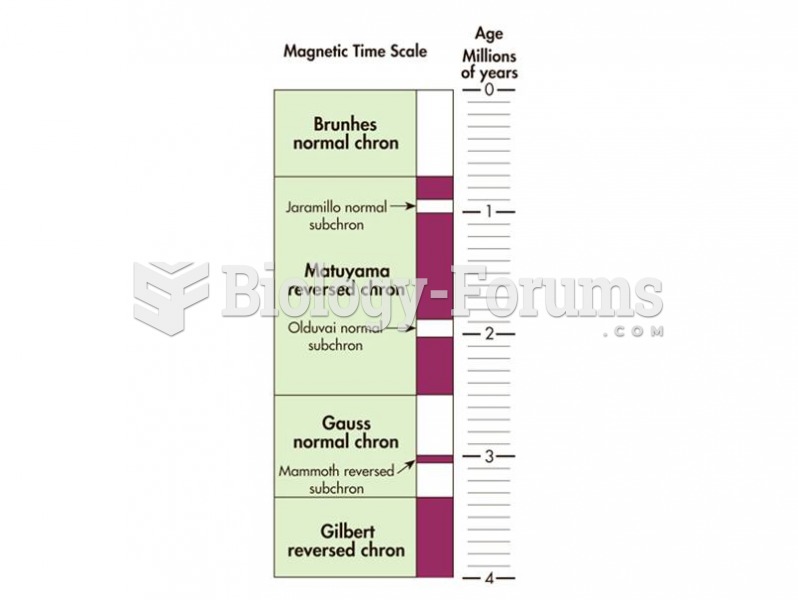 The geomagnetic polarity time scale shows how Earth’s magnetic pole has changed through geologic tim
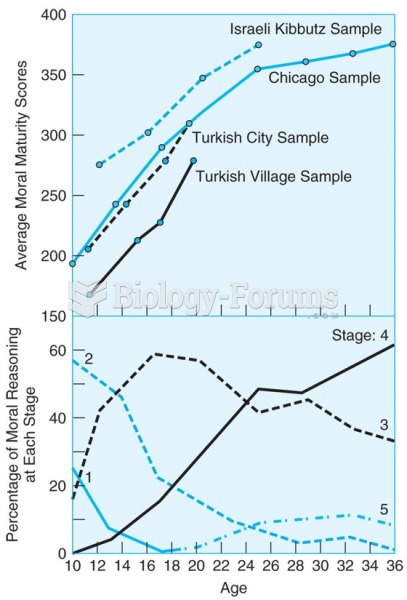 The upper panel shows that scores of four diverse samples of boys on a moral reasoning test show a ...
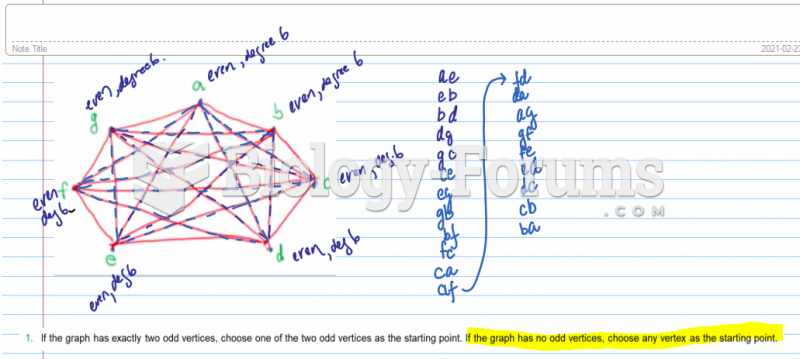 Use Fleury’s algorithm to determine Euler Circuit in the following graph. Exhibit exactly one ...
 Iraqi market
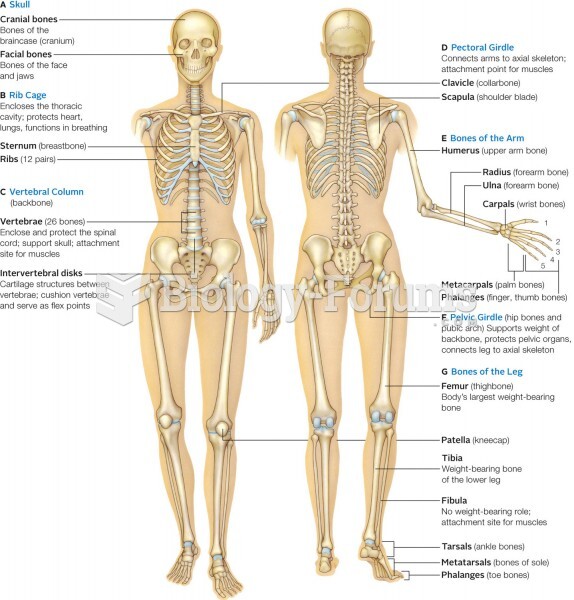 Major bone (tan) and cartilage (light blue) elements of the human skeleton. Inset shows regions of v