This topic contains a solution. Click here to go to the answer
|
|
|

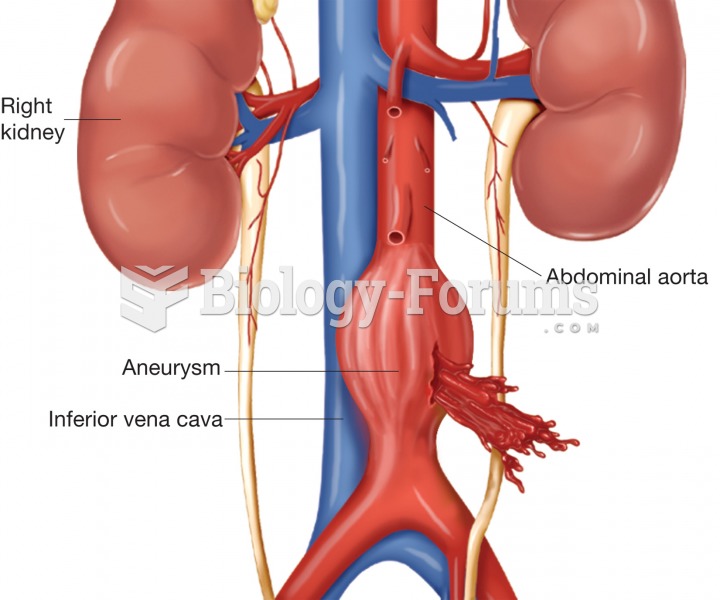 Illustration of a large aneurysm in the abdominal aorta that has ruptured.
 A nurse shows empathy to a client.
 Large-Flowered Trillium
 Graph of 3 compounds tested
 C. Wright Mills (1916-1962) was a controversial figure in sociology because of his analysis of the ...
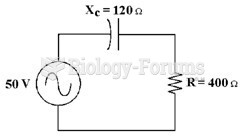 If the frequency equals 60 Hz in Figure 10-1, what is the value of capacitance?