|
|
|

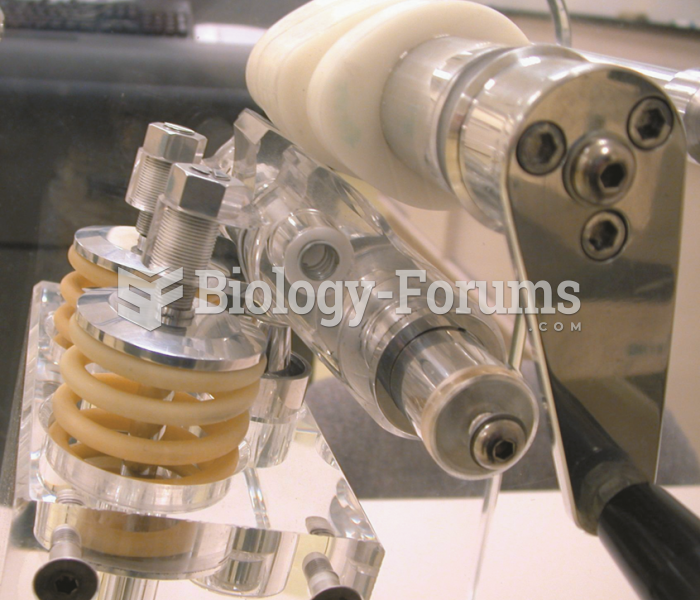 A plastic mock-up of a Honda VTEC system that uses two different camshaft profiles: one for low ...
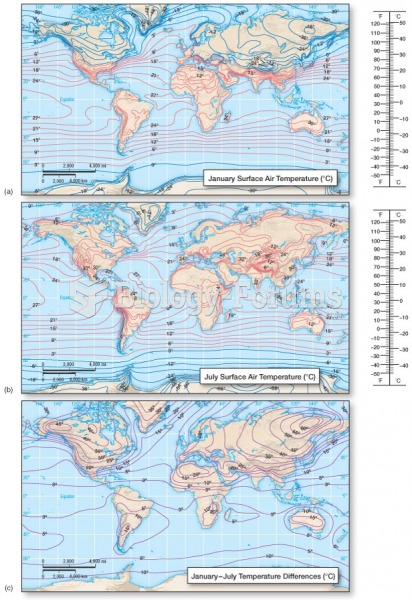 The Greenhouse Effect: Influences on Temperature
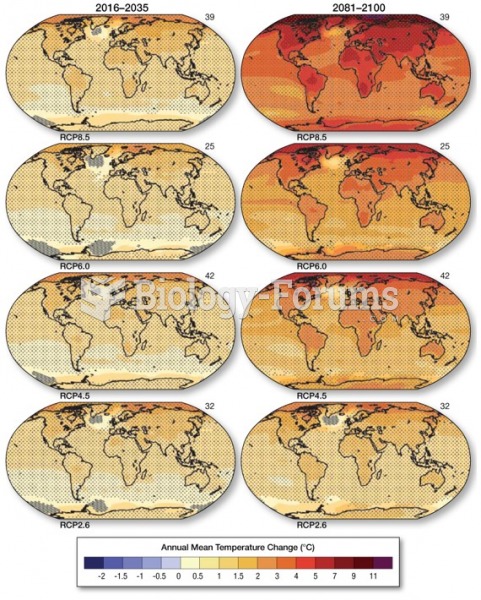 Predicted Temperature Trends Through the 21st Century
 Thick-walled barrel-shaped arthrospores on thin glass like hyphae; the room-temperature form of ...
 Dash Warning Lights: Coolant Temperature Light
 Effects of acidosis and alkalosis on the oxyhemoglobin dissociation curve