|
|
|

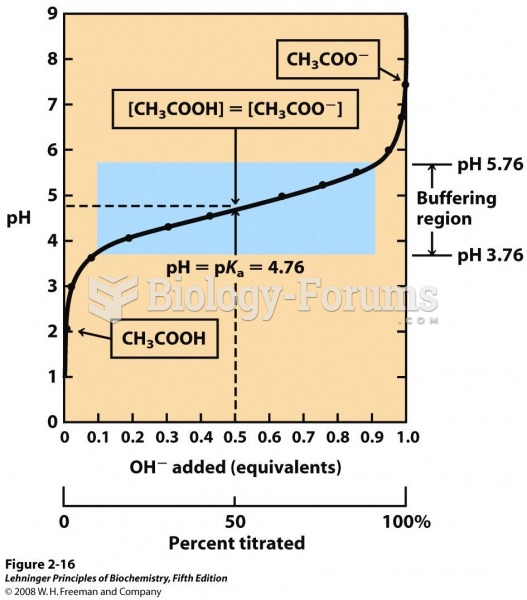 The titration curve of acetic acid
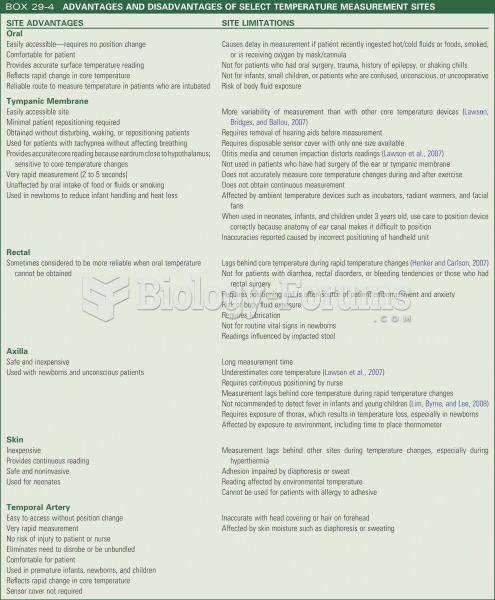 Advantages and disadvantages of select temperature measurement sites
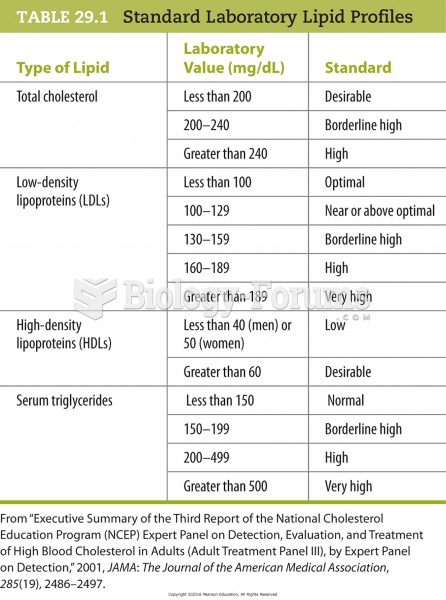 Standard Laboratory Lipid Profiles
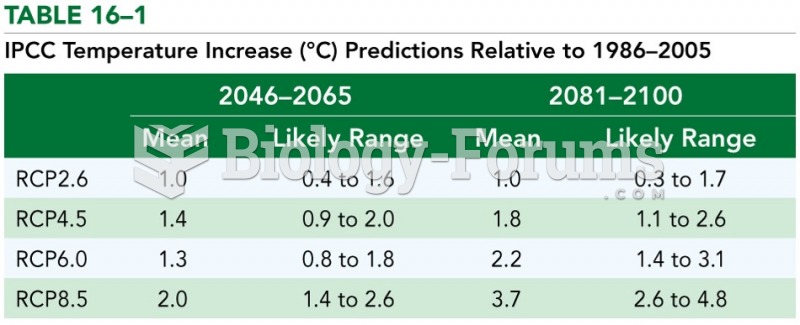 IPCC Temperature Increase Predictions Relative to 1986-2005
 Chlamydospore or spherule that occurs at body temperature.
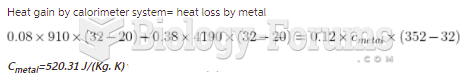 An 80-g aluminum calorimeter contains 380 g of water at an equilibrium temperature of A piece ...