|
|
|

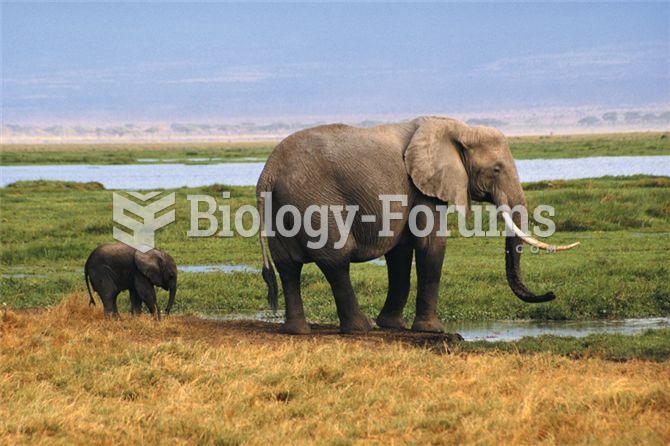 The deer mouse and the African elephant represent extremes among mammals of r versus K selection.
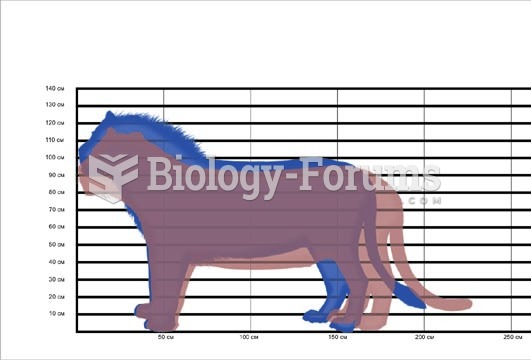 Comparative profiles of the lion and tiger.
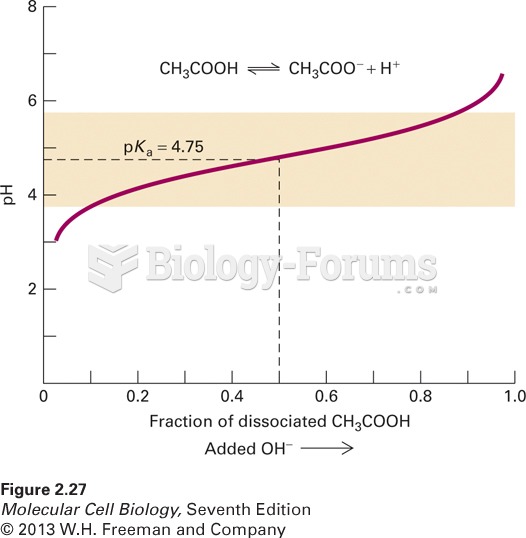 The titration curve of the buffer acetic acid (CH3COOH)
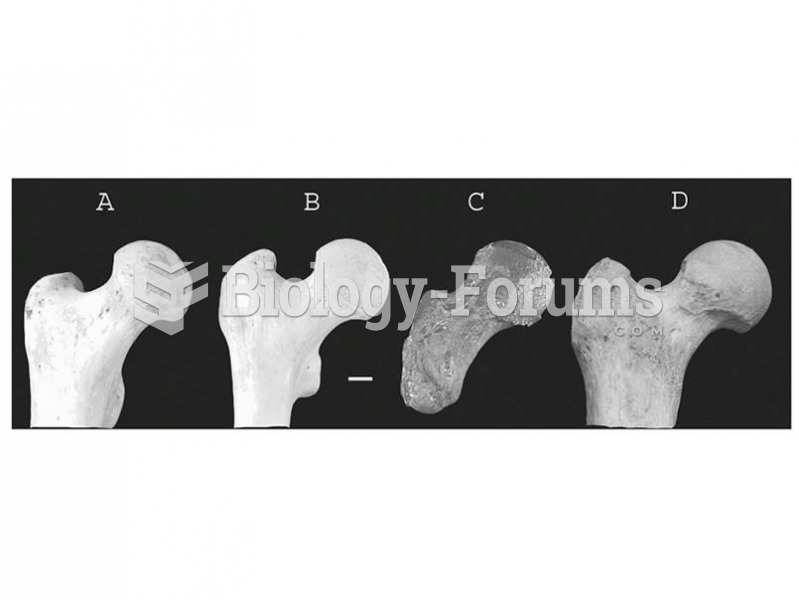 The fossil record of chimpanzees is sparse. The femur from Kikongo, Uganda (c) may represent a late
 Memory saver. The part numbers represent components from Radio Shack®.
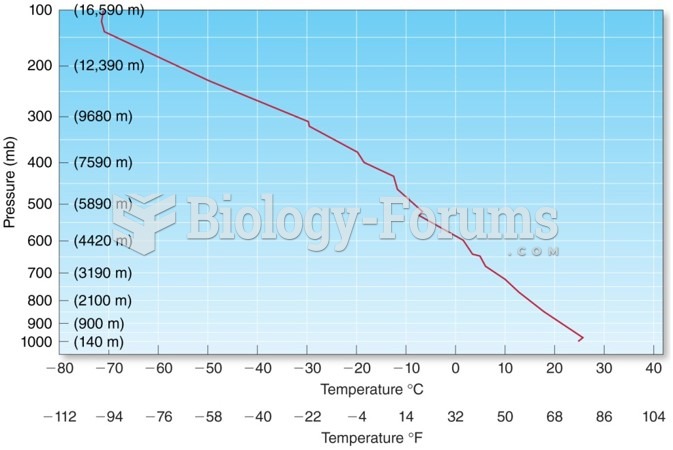 Thermodynamic Diagrams and Vertical Temperature Profiles