|
|
|

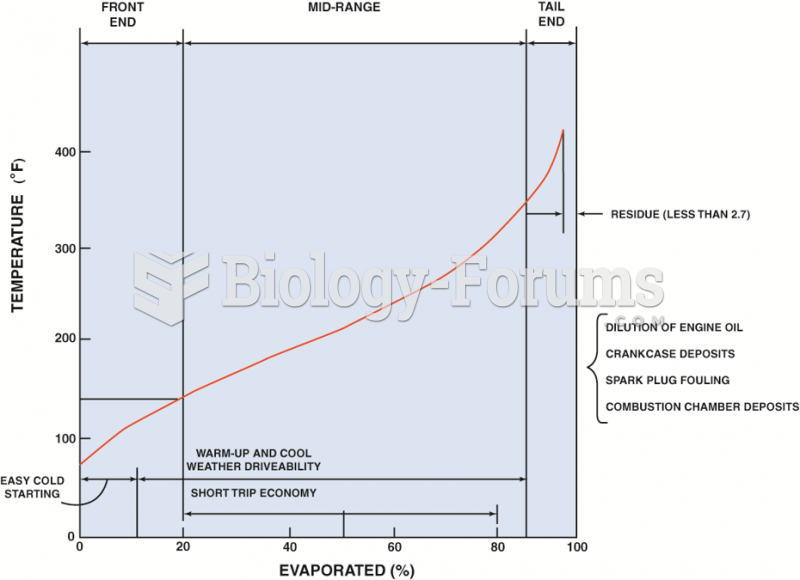 A typical distillation curve. Heavier molecules evaporate at higher temperatures and contain more ...
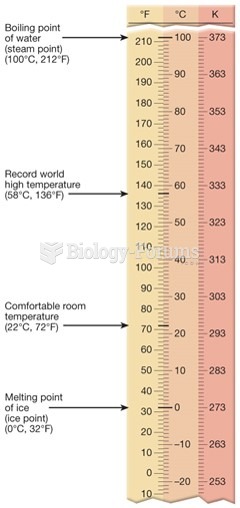 Temperature Scales
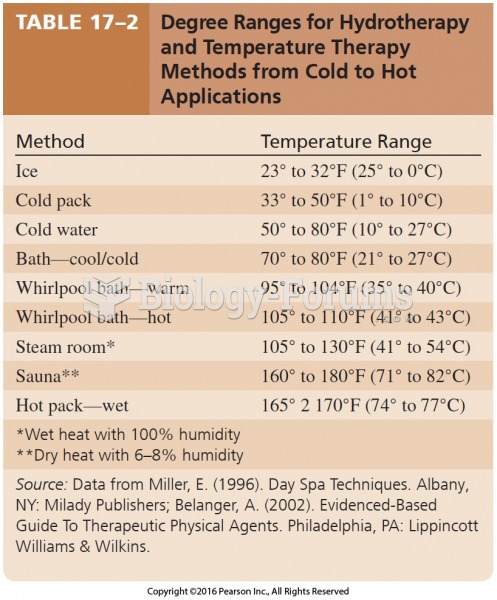 Degree Ranges for Hydrotherapy and Temperature Therapy Methods from Cold to Hot Applications
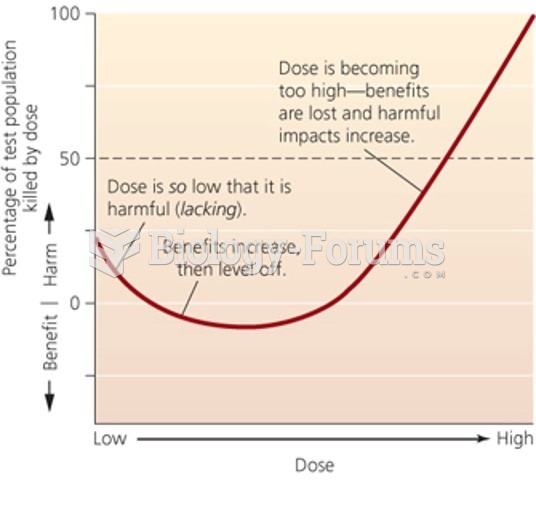 J or U dose-response curve
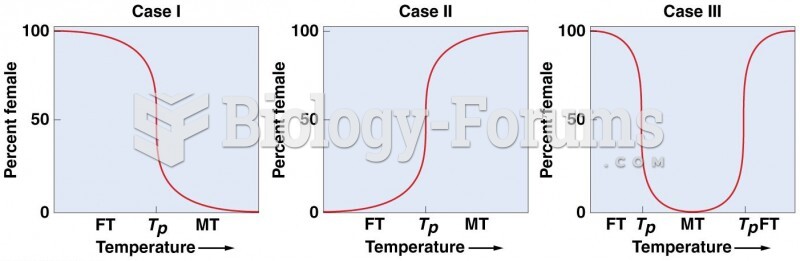 Three different patterns of temperature-dependent sex determination (TSD) in reptiles
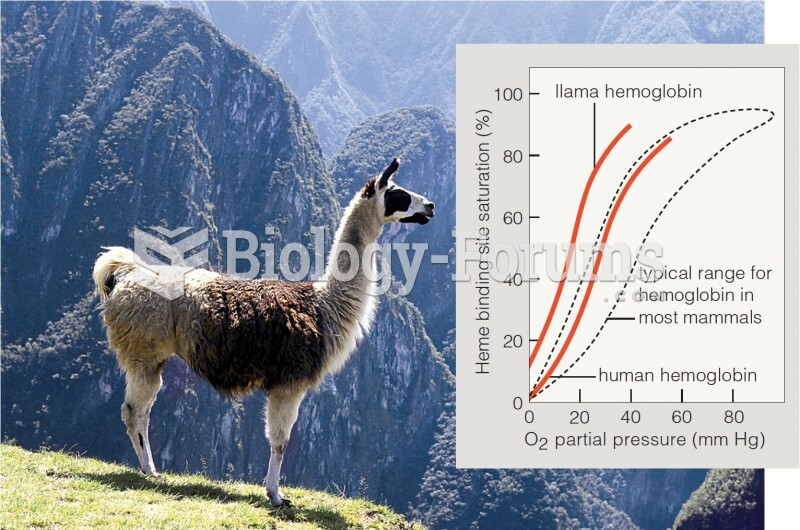 Saturation curve for hemoglobin of humans, llamas, and other mammals.