|
|
|

 Use of the tympanic thermometer to measure body temperature.
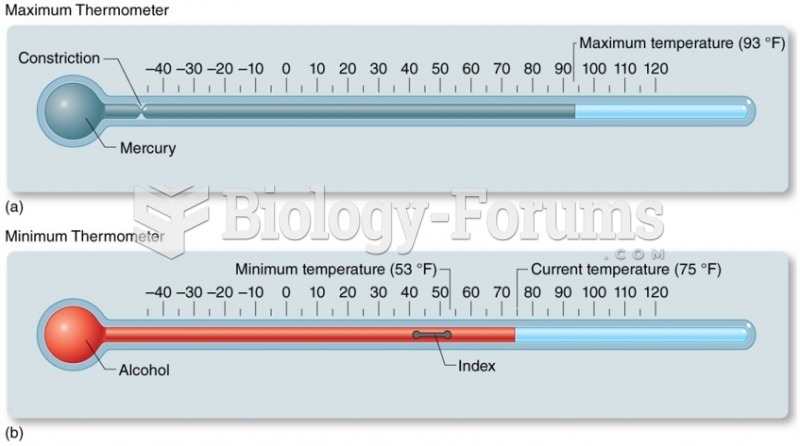 Measurement of Temperature
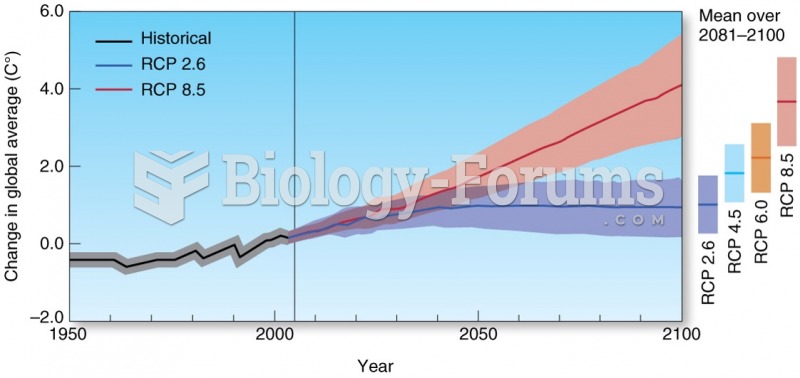 Predicted Temperature Trends Through the 21st Century
 IPCC Temperature Increase Predictions Relative to 1986-2005
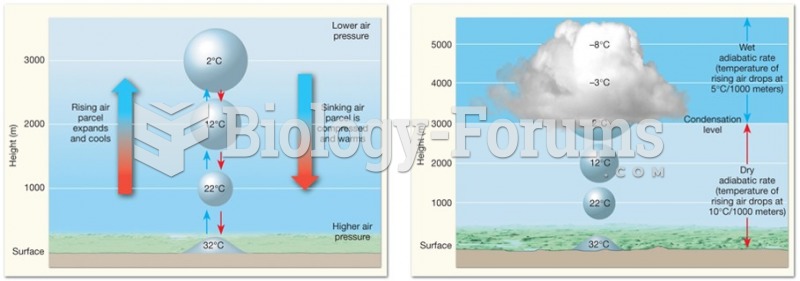 Adiabatic Temperature Changes
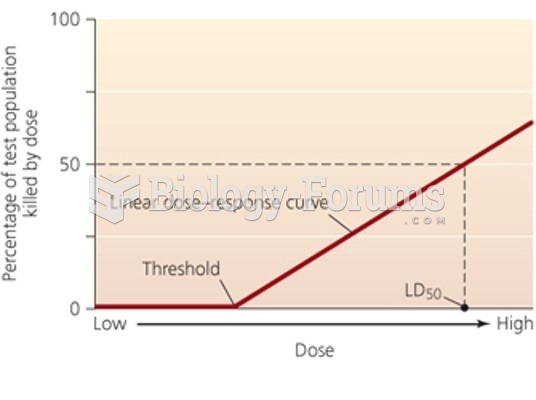 Dose-response curve with threshold