This topic contains a solution. Click here to go to the answer
|
|
|

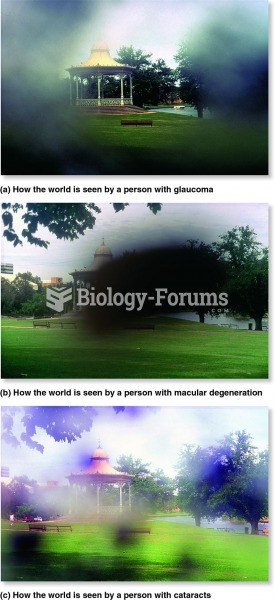 The visual field as seen by a person with (a) glaucoma, (b) macular degeneration, and (c) cataracts.
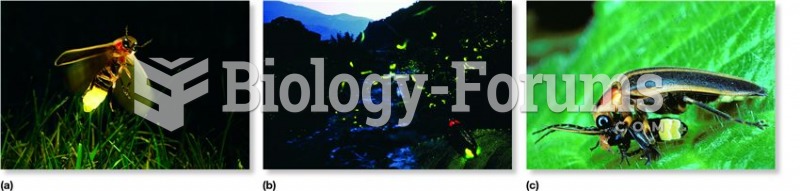 Visual communication in fireflies.
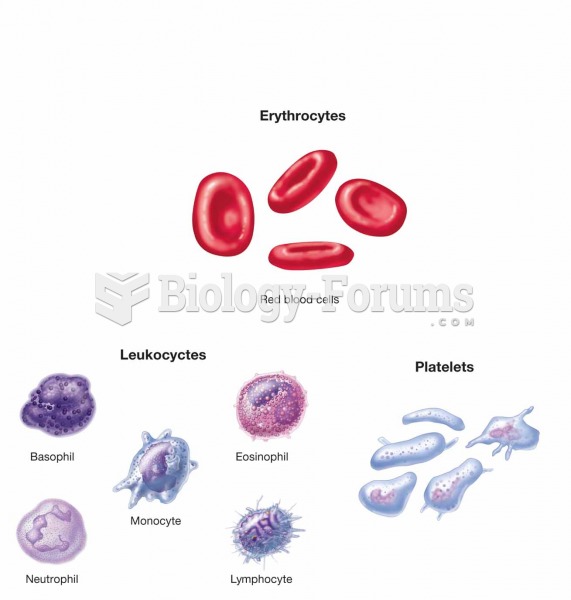 Formed elements of blood: erythrocytes, leukocytes (neutrophils, eosinophils, basophils, lymphocytes
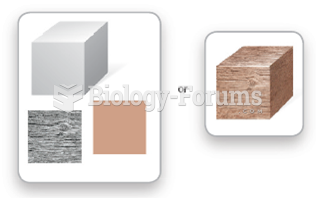 Working Memory Binds Visual Features into a Single Chunk
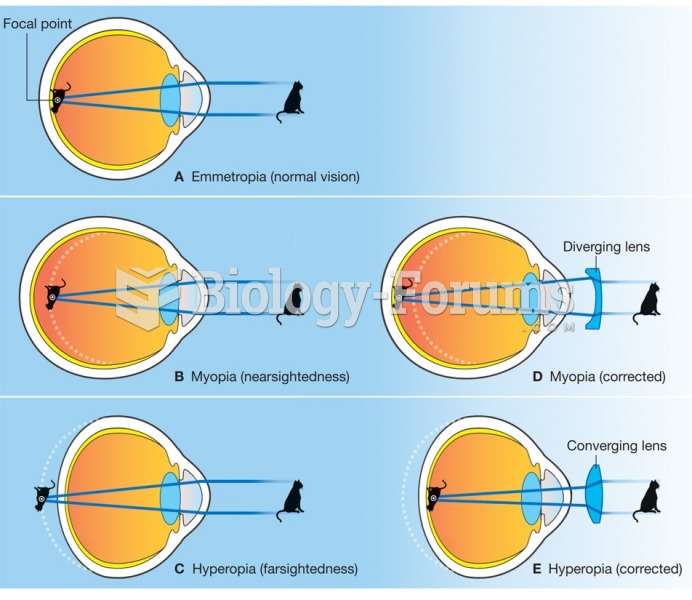 How lenses correct visual problems: (A) emmetropia; (B) myopia; (C) hyperopia; (D) corrected myopia; ...
 Effects of Ac and Ds elements on gene expression