This topic contains a solution. Click here to go to the answer
|
|
|

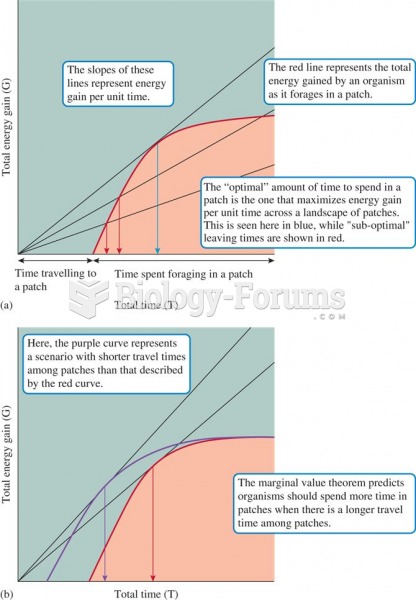 A graphical representation of the marginal value theorem.
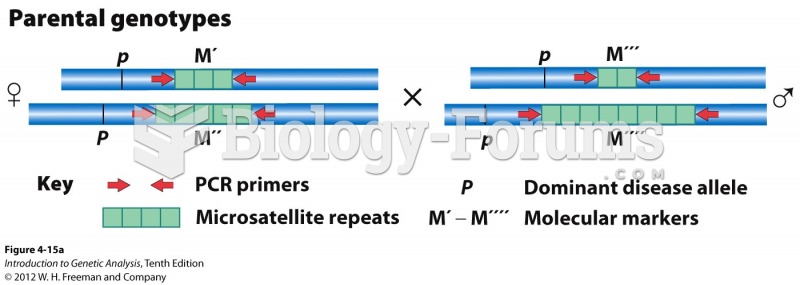 A microsatellite locus can show linkage to a disease gene
 Frogs Are Having Serious Problems
 How to solve all of life's problems
 Word Problems Algebra Questions Help pls
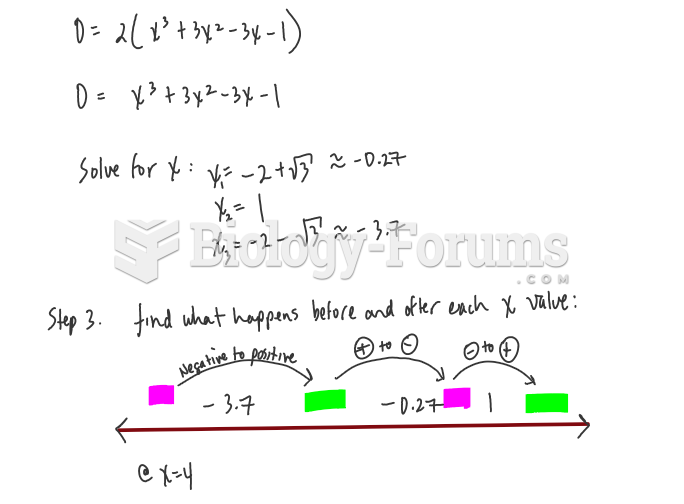 Calculus help: Show that y has three points of inflection and they all lie on...