This topic contains a solution. Click here to go to the answer
|
|
|

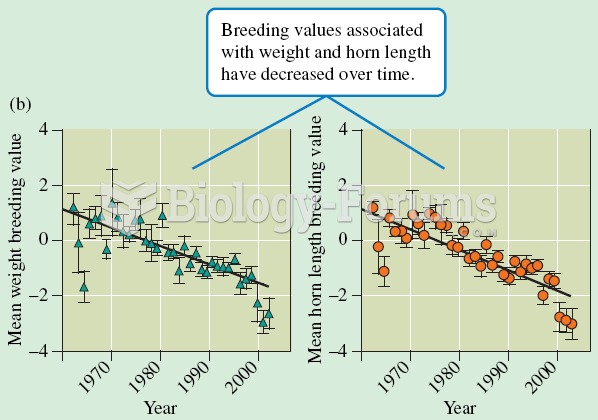 (a) Longevity decreases with increased horn-length breeding value of harvested rams. (b) Mean-weight
 Scaling the Earth down to the size of a basketball, the Moon is roughly the size of a tennis ball. T
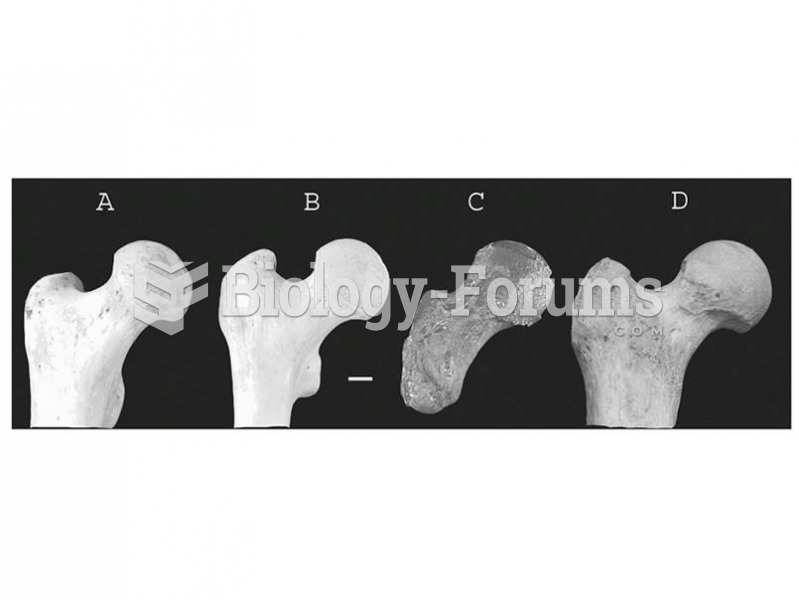 The fossil record of chimpanzees is sparse. The femur from Kikongo, Uganda (c) may represent a late
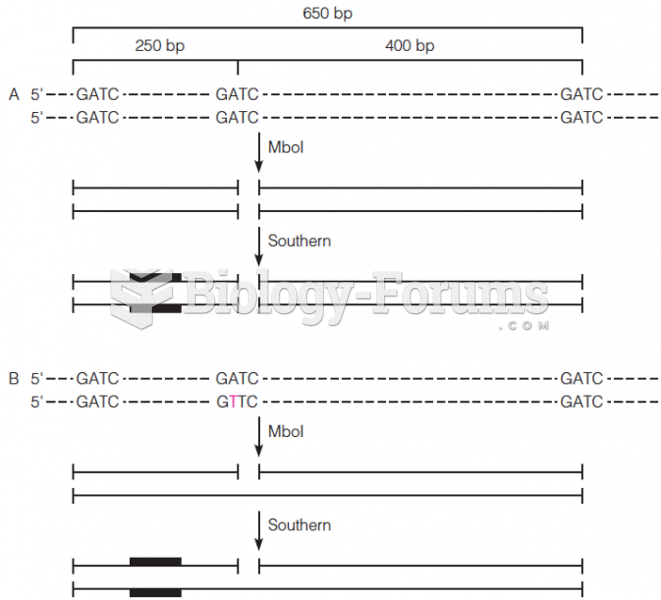 Analysis of a restriction fragment length Polymorphism
 The allowable compressive bearing capacity of a soil is 8000 psf. What should be the length of ...
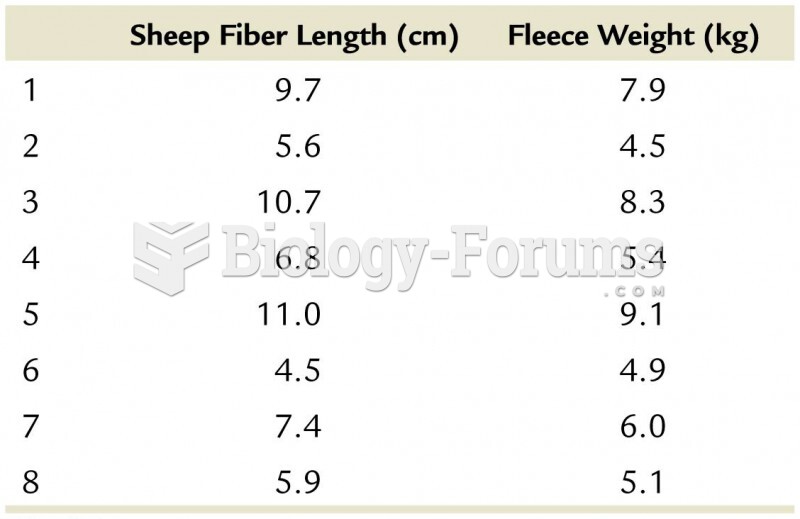 Sheep Fiber Length (cm) vs Fleece Weight (kg)