This topic contains a solution. Click here to go to the answer
|
|
|

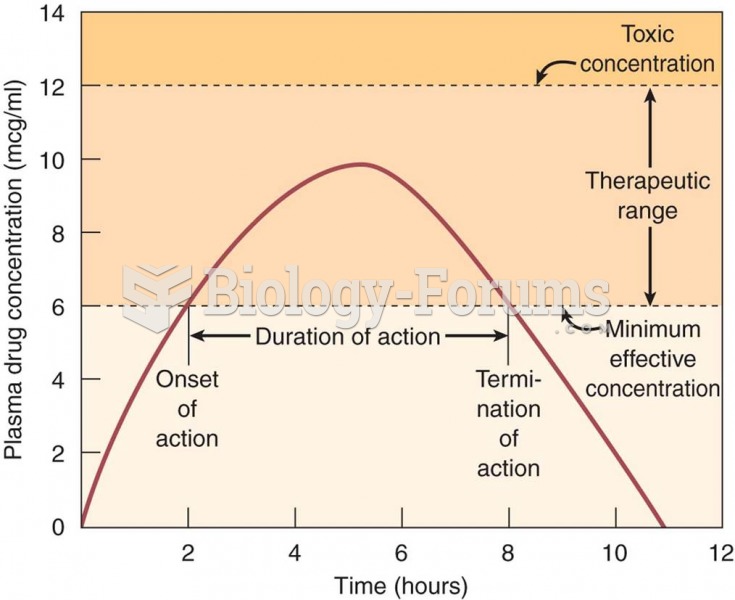 Single-dose drug administration: pharmacokinetic values for this drug are as follows: onset of actio
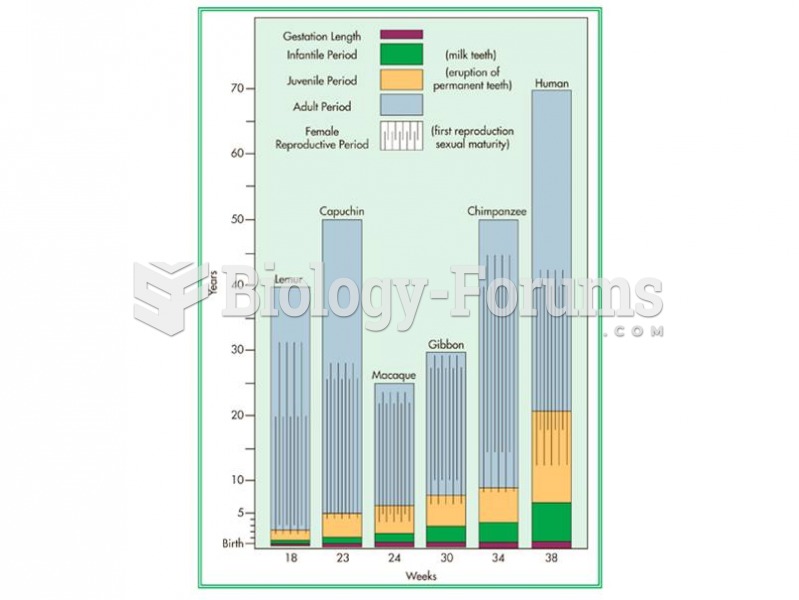 Primates exhibit prolonged life histories, spending more time in each stage of life than most other
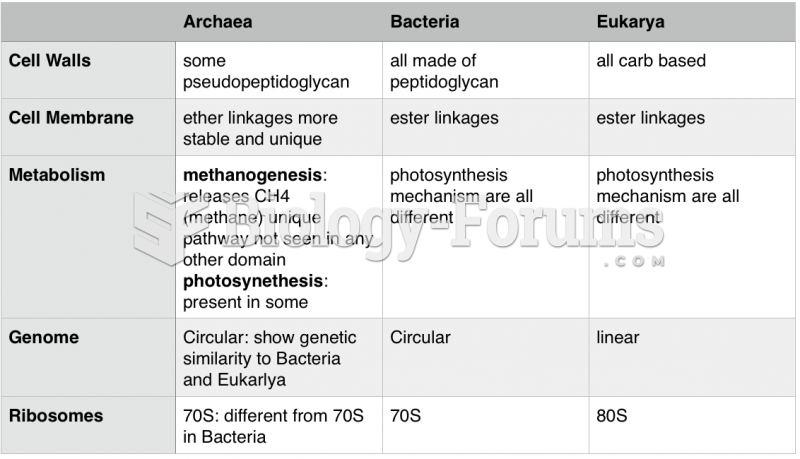 Archaea, Eukarya, Bacteria Differences Chart
 Bell’s palsy, showing typical drooping of one side of the face.
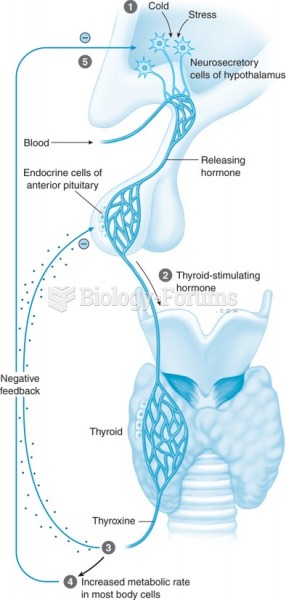 Mechanism of the thyroid gland showing a stimulus (1) that causes the release of TSH (2) and then ...
 Time-of-entry mapping