This topic contains a solution. Click here to go to the answer
|
|
|

 The Tsavo Man-Eaters on display in the Field Museum of Natural History in Chicago, Illinois.
 A female gorilla exhibiting tool use by using a tree trunk as a support whilst fishing herbs.
 Display is the only position to view the firing lines of all cylinders. Cylinder 1 is displayed on ...
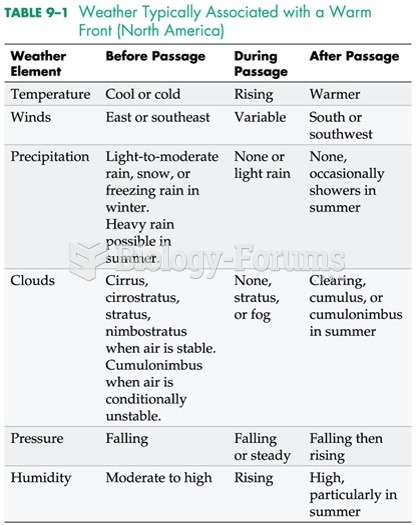 Weather Typically Associated with a Warm Front (North America)
 Population Indicators