This topic contains a solution. Click here to go to the answer
|
|
|

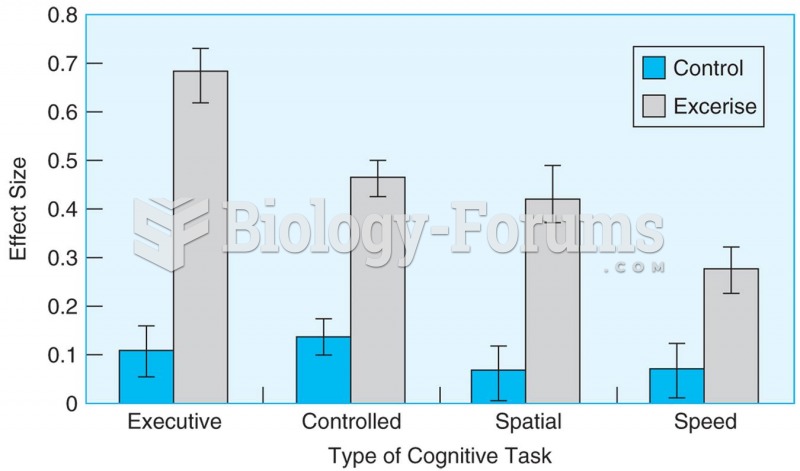 Meta-analysis of 18 studies shows that aerobic exercise causes better performance in older adults on
 Latest Post Display
 Display piece, Yoruba culture.
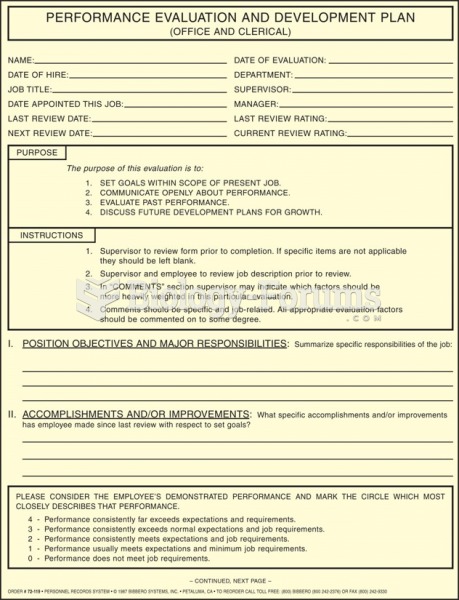 Example of an employee performance evaluation form.
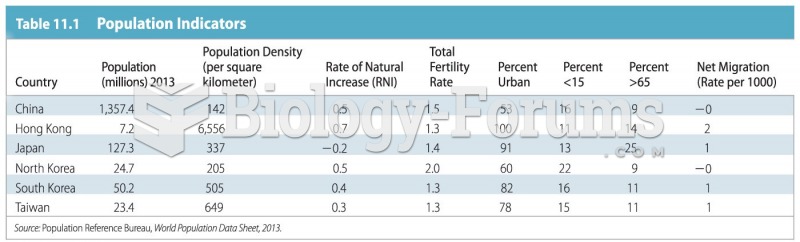 Population Indicators
 Tree rings as indicators of environmental change