This topic contains a solution. Click here to go to the answer
|
|
|

 Threat display by a Sydney funnel-web spider (Atrax robustus).
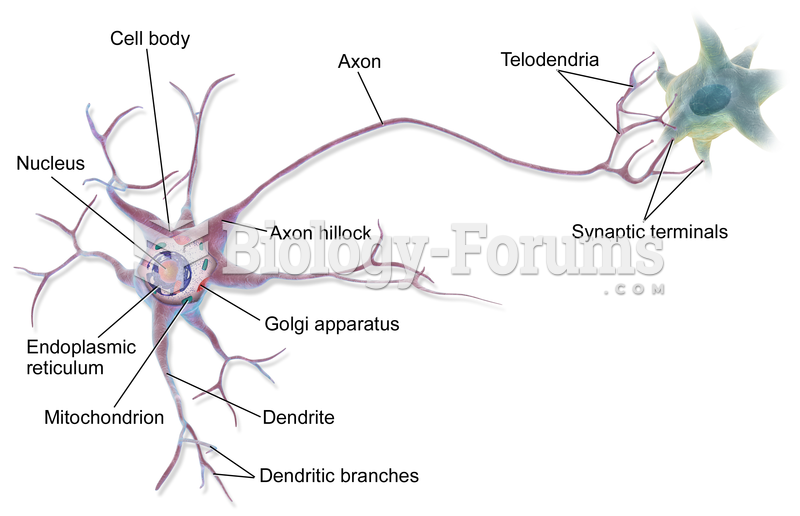 Graphical Multipolar Neuron
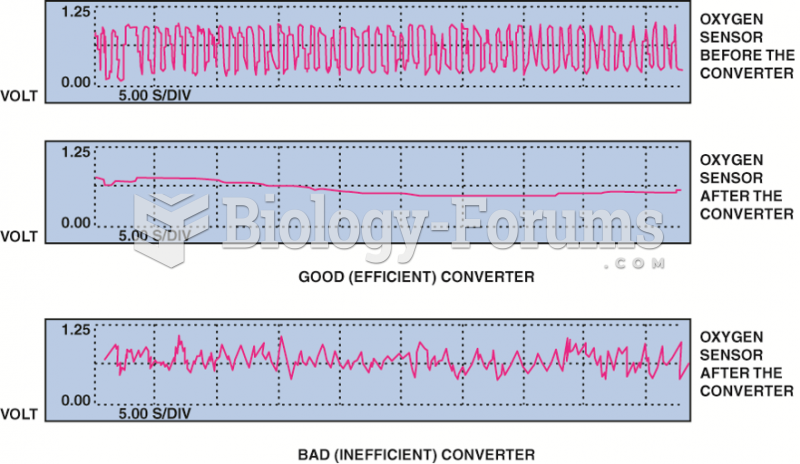 The post-catalytic converter oxygen sensor should display very little activity if the catalytic ...
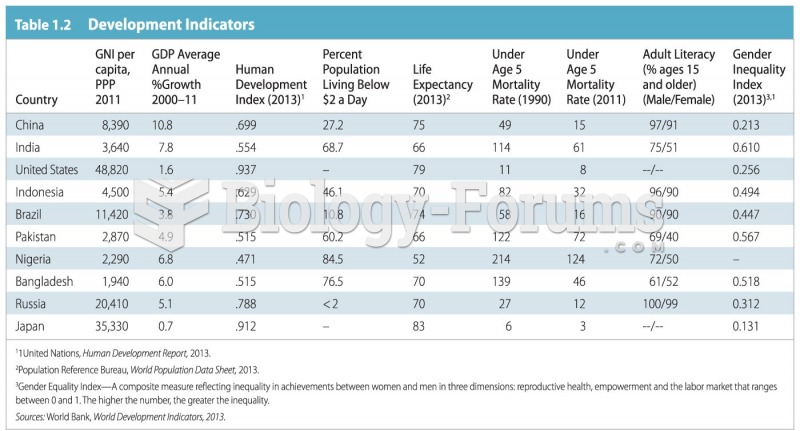 Indicators of Economic Development
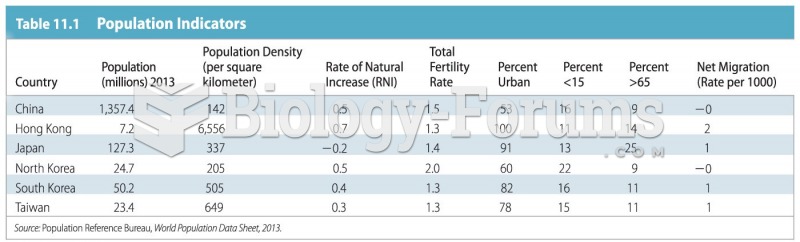 Population Indicators