This topic contains a solution. Click here to go to the answer
|
|
|

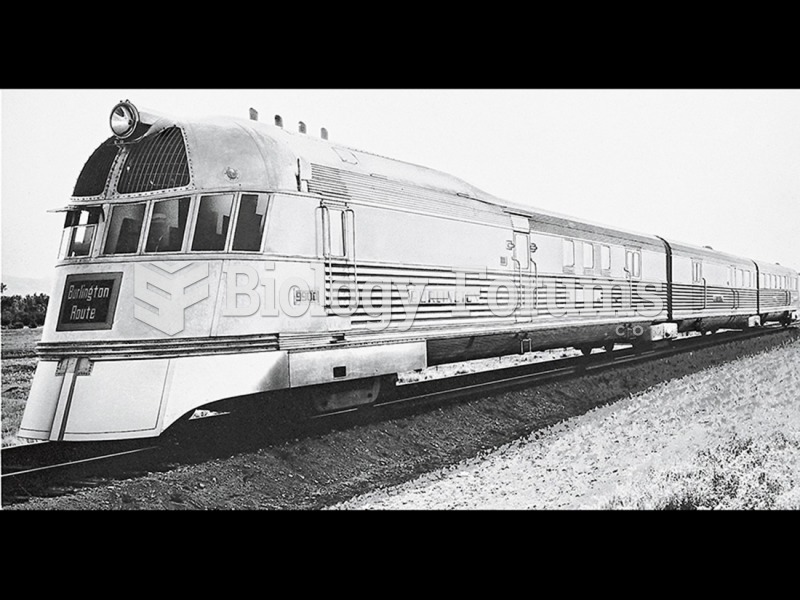 Chrysler Salon, N. Y. C., showing the 1937 Chrysler Airflow four-door sedan on display in the ...
 The U.S. Department of Agriculture offers the SuperTracker tool to help you track, analyze, and plan ...
 Women have even more need than men to plan for retirement; at retirement age they have typically ...
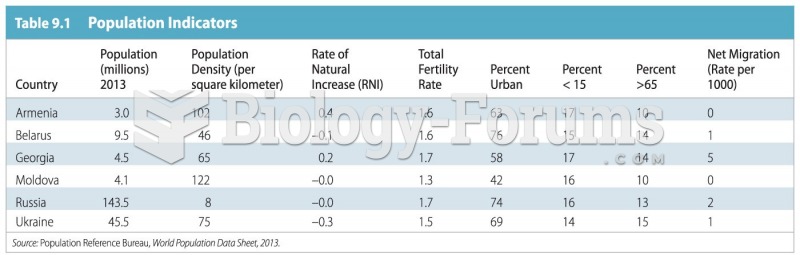 Population Indicators
 Automotive Engine Performance, 5th Edition
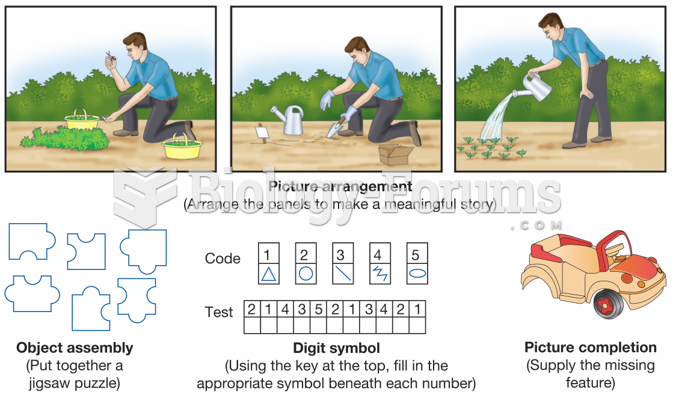 Performance Tasks on the Wechsler Tests