The most common graphical presentation of quantitative data is a
a. histogram.
b. bar chart.
c. stem and leaf display.
d. pie chart.
Question 2
All of the following are true about qualitative forecasting methods except
a. They generally involve the use of expert judgment to develop forecasts.
b. They assume the pattern of the past will continue into the future.
c. They are appropriate when past data on the variable being forecast are not applicable.
d. They are appropriate when past data on the variable being forecast are not available.

 Colorectal cancer. The most common sites of tumor development are shown.
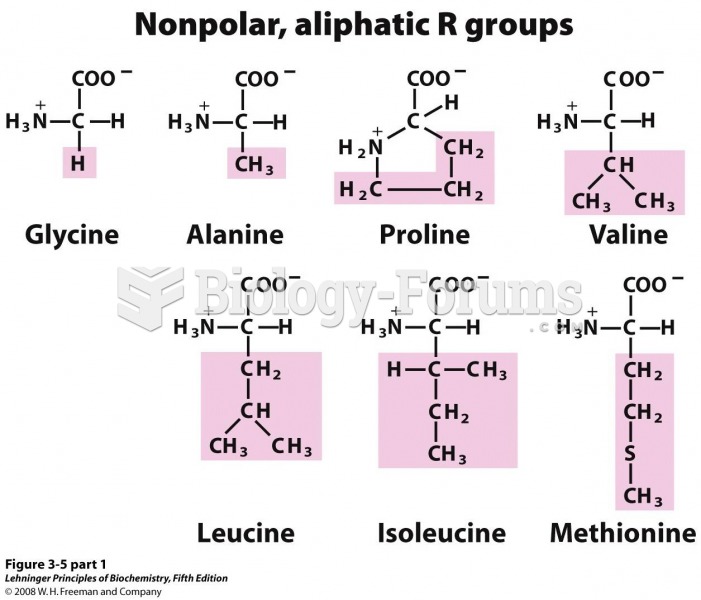 The 20 common amino acids of proteins
 The nucleotide cyclic AMP (cAMP), a common messenger molecule.
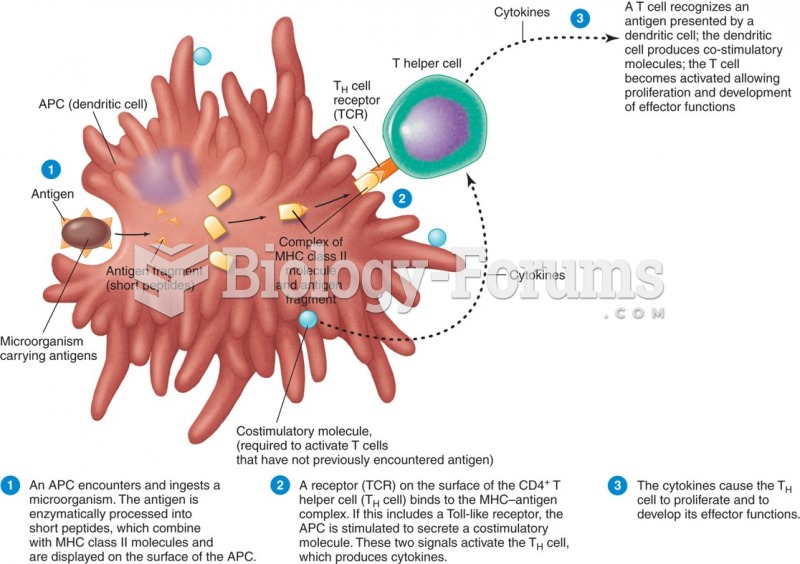 Antigen presentation to a T cell.
 Effects of Common Herbs in Spa Treatments
 Satellite data showing net primary production. Productivity is coded as red (highest) down through o