|
|
|

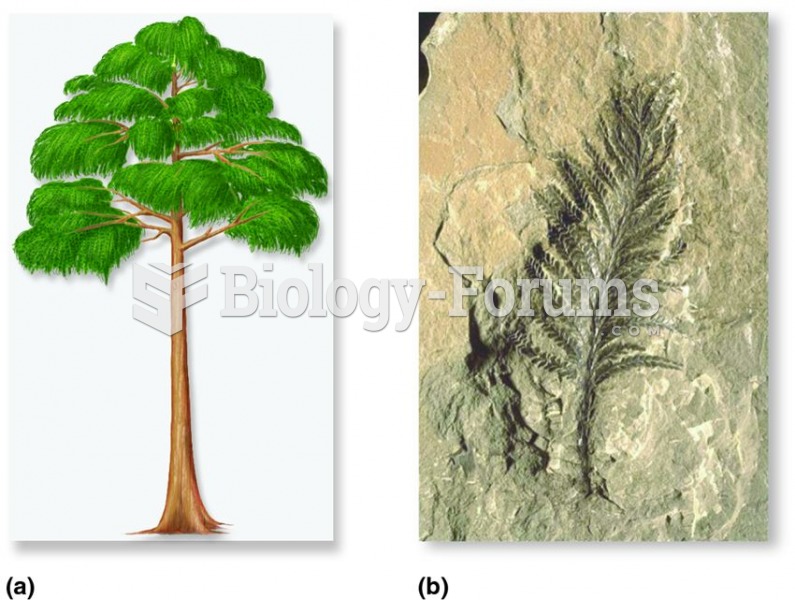 Wood first appeared in plants called progymnosperms.
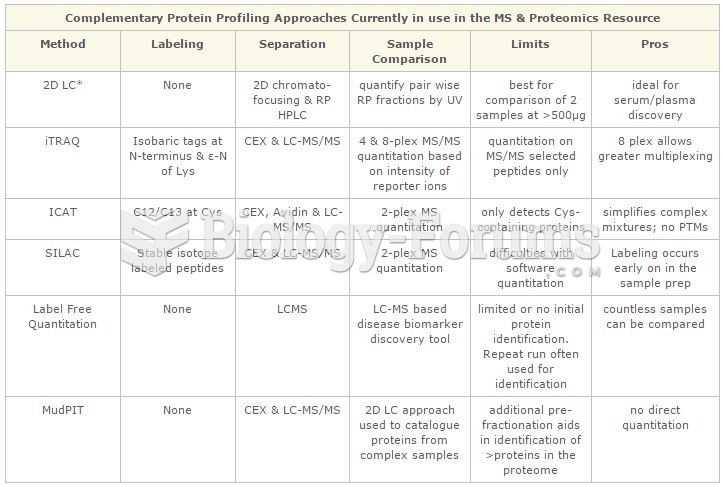 Protein Profiling Chart
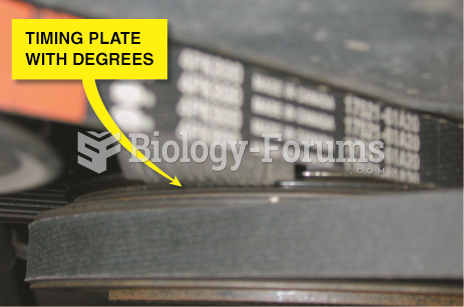 The engine is rotated until the timing marks on the front of the crankshaft line up with zero ...
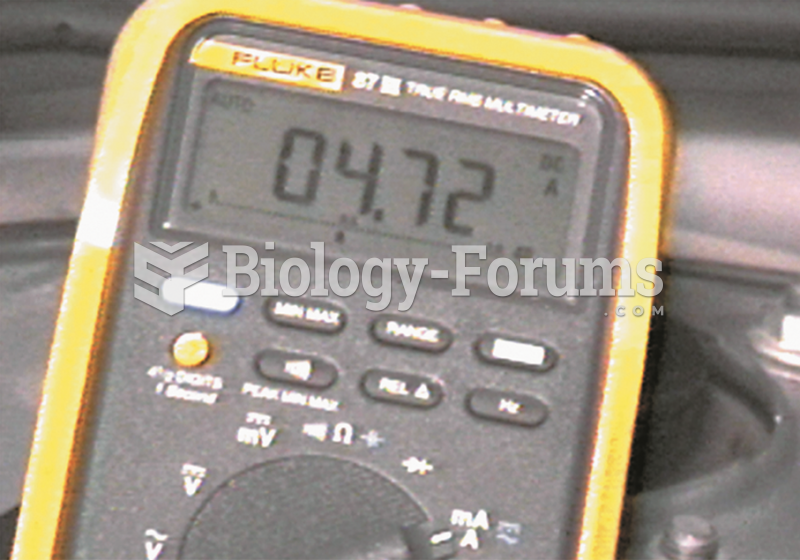 Connect the leads of the meter to contacts 30 and 87 of the relay socket. The reading of 4.7 ...
 Waiting in line for a photocopier
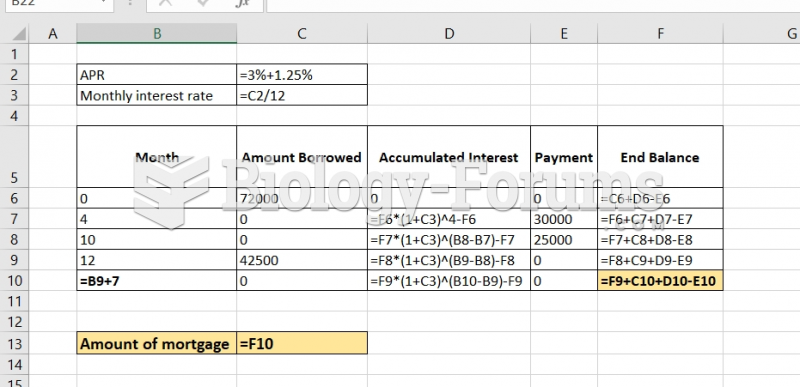 Raman has a line of credit loan with the ICICI bank. The initial loan balance was $72000.00. ...