Which of the following graphs provide information on outliers and IQR of a data set?
a. Histogram
b. Line chart
c. Scatter chart
d. Box plot
Question 2
In forward selection stepwise regression with ten predictor variables, which of the following statements is correct?
a. The procedure starts with 10 predictor variables and eliminate one predictor at each iteration.
b. The procedure starts with 2 predictor variables and add one predictor at each iteration.
c. The procedure starts with 1 predictor variable and add one predictor at each iteration.
d. The procedure starts with no predictor variables and add one predictor at each iteration.

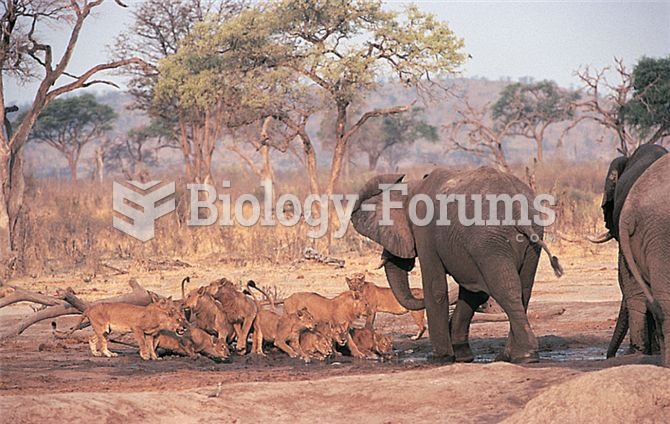 Large size can provide a refuge from predators. While young African elephants may be vulnerable to p
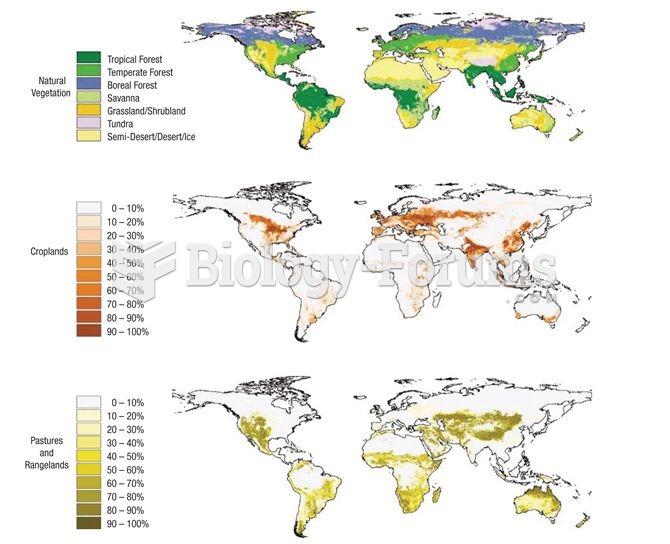 Extent of agricultural activity across the planet (data from Foley et al. 2005).
 Using alert labels enables the medical staff to quickly identify important information such as ...
 Farmers’ markets provide fresh, local produce to consumers
 Gamete genotype frequencies calculated from genetic linkage data
 Ribosome structure and tRNA-binding sites interpreted from cryo-EM–generated data