Which of the following graphs provide information on outliers and IQR of a data set?
a. Histogram
b. Line chart
c. Scatter chart
d. Box plot
Question 2
In forward selection stepwise regression with ten predictor variables, which of the following statements is correct?
a. The procedure starts with 10 predictor variables and eliminate one predictor at each iteration.
b. The procedure starts with 2 predictor variables and add one predictor at each iteration.
c. The procedure starts with 1 predictor variable and add one predictor at each iteration.
d. The procedure starts with no predictor variables and add one predictor at each iteration.

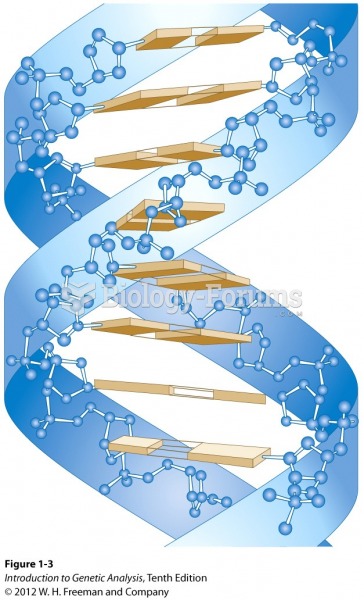 DNA is biological information
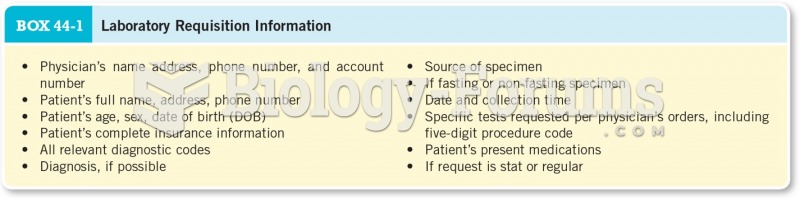 Laboratory Requisition Information
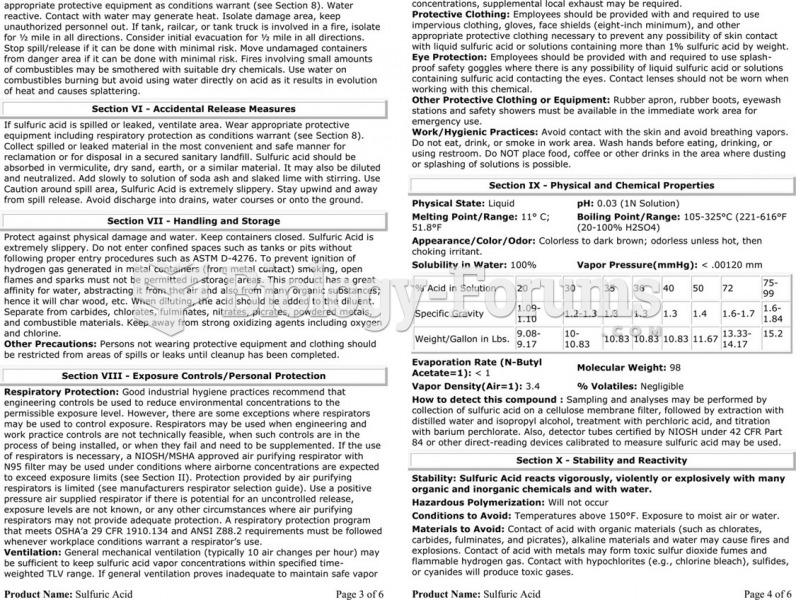 The material safety data sheet (MSDS) for sulfuric acid showing the detailed technical information ...
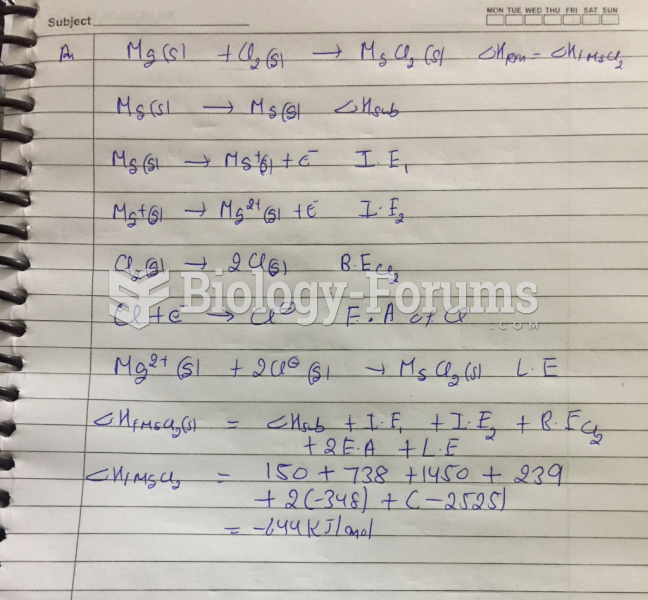 Use the information in the above table to establish a Born-Haber cycle to determine the ...
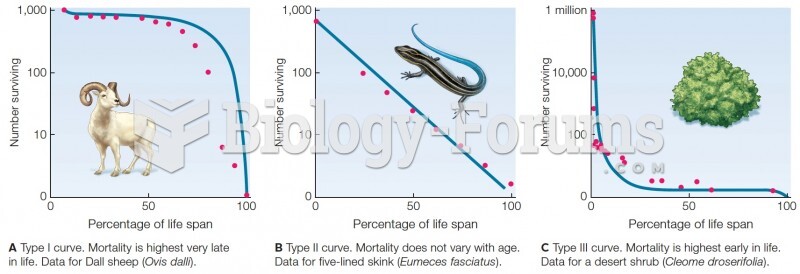 Survivorship curves. Blue lines are theoretical curves. Red dots are data from field studies.
 Sturtevant’s Recombination Data for Five X-Linked Genes in Drosophila