Which of the following graphs provide information on outliers and IQR of a data set?
a. Histogram
b. Line chart
c. Scatter chart
d. Box plot
Question 2
In forward selection stepwise regression with ten predictor variables, which of the following statements is correct?
a. The procedure starts with 10 predictor variables and eliminate one predictor at each iteration.
b. The procedure starts with 2 predictor variables and add one predictor at each iteration.
c. The procedure starts with 1 predictor variable and add one predictor at each iteration.
d. The procedure starts with no predictor variables and add one predictor at each iteration.

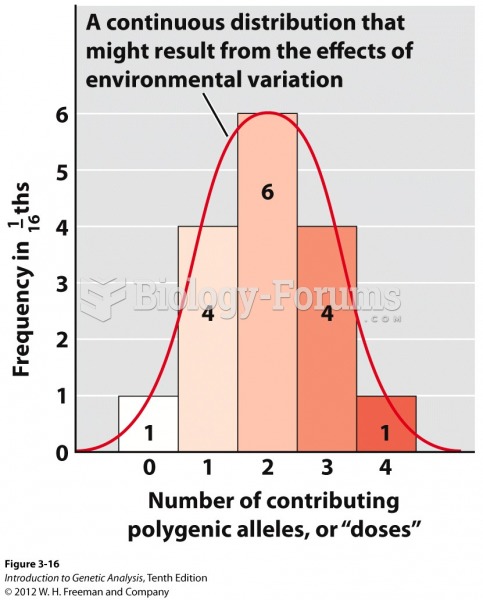 Histogram of polygenes from a dihybrid self
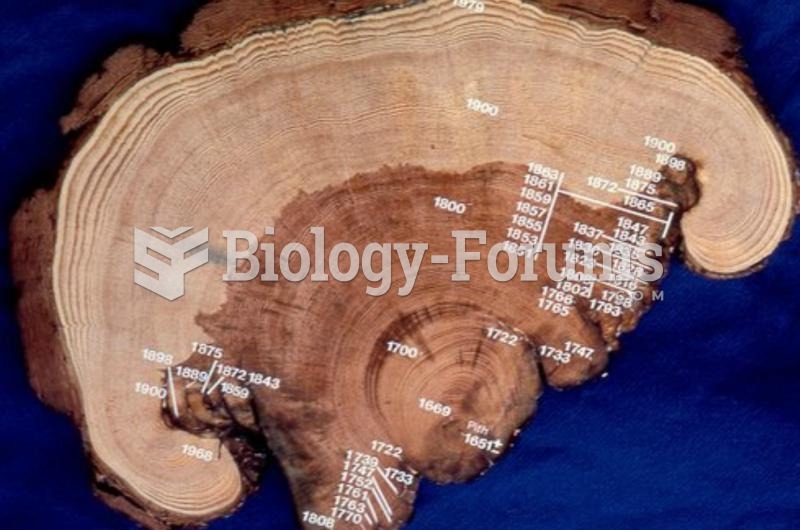 tree-ring data
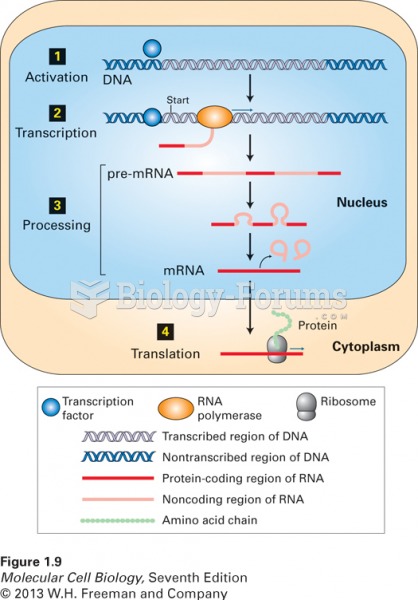 The information coded in DNA
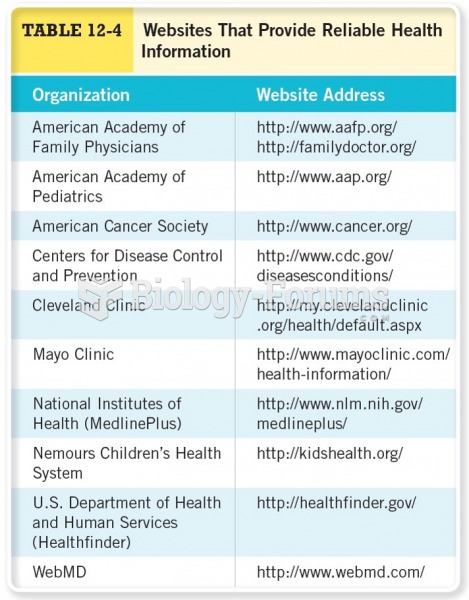 Websites that Provide Reliable Health Information
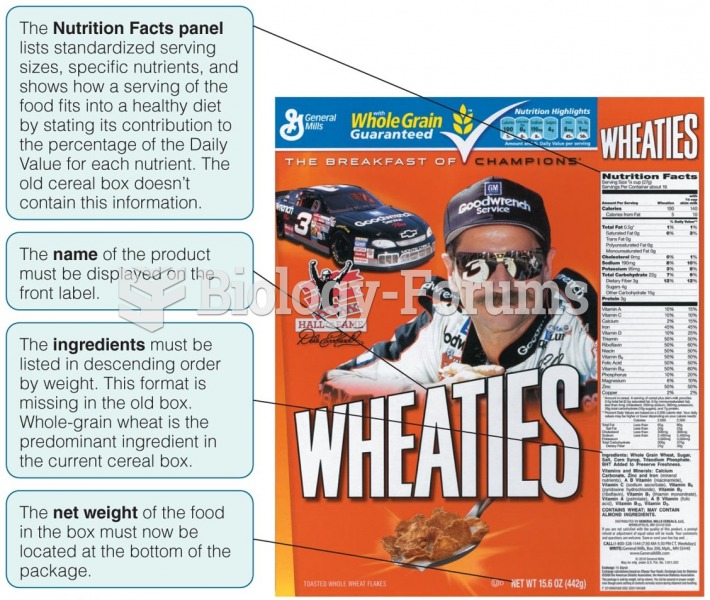 The Food Label Provides Valuable Consumer Information Manufacturers must adhere to strict labeling
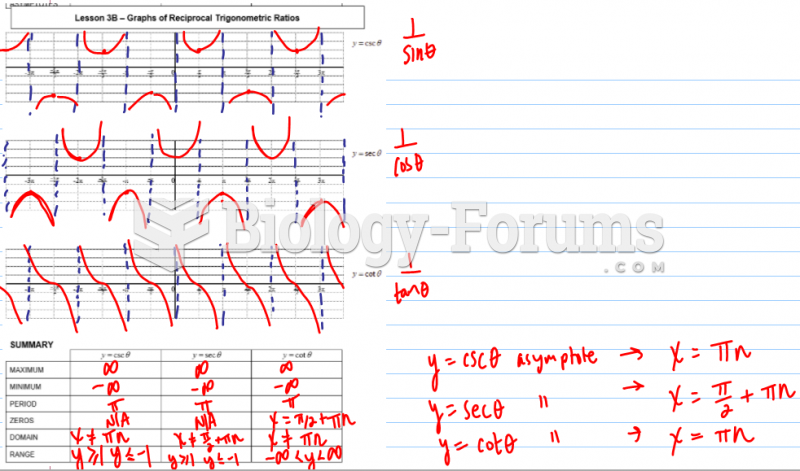 Graphs of Primary Trigonometric Ratios