Which of the following graphs provide information on outliers and IQR of a data set?
a. Histogram
b. Line chart
c. Scatter chart
d. Box plot
Question 2
In forward selection stepwise regression with ten predictor variables, which of the following statements is correct?
a. The procedure starts with 10 predictor variables and eliminate one predictor at each iteration.
b. The procedure starts with 2 predictor variables and add one predictor at each iteration.
c. The procedure starts with 1 predictor variable and add one predictor at each iteration.
d. The procedure starts with no predictor variables and add one predictor at each iteration.

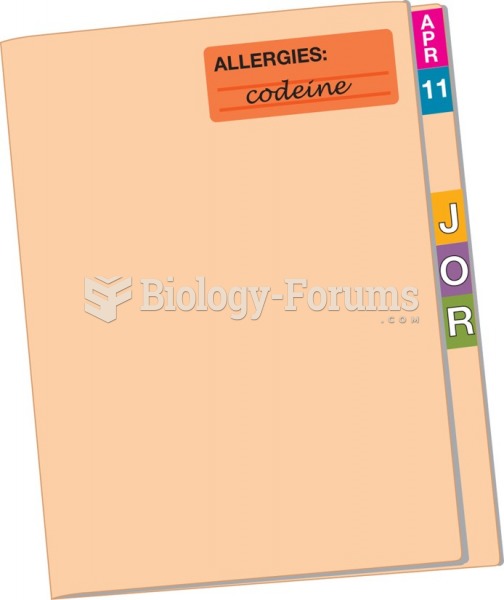 Using alert labels enables the medical staff to quickly identify important information such as ...
 The offspring of the microchip—from computers to cell phones—offer access to vast information ...
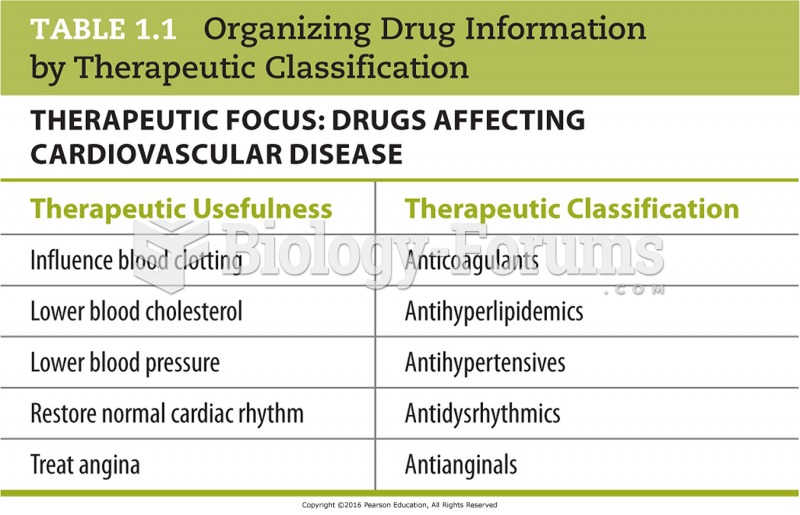 Organizing Drug Information by Therapeutic Classification
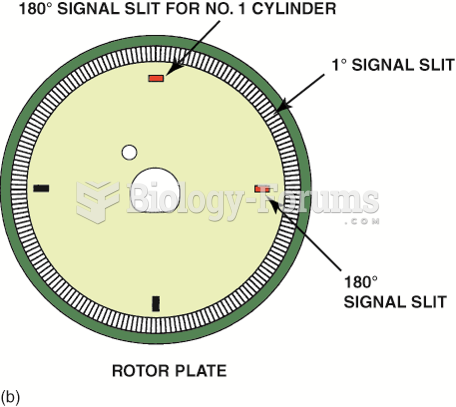 Cylinder 1 slit signals the computer the piston position for cylinder 1. The 1-degree slits provide ...
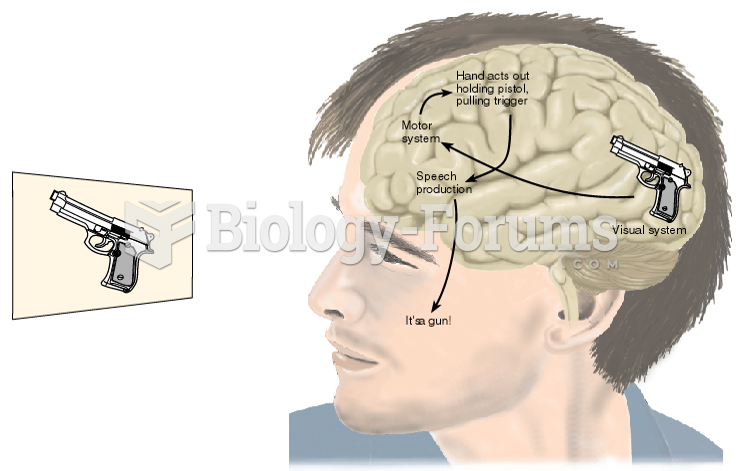 Hypothetical Exchanges of Information within the Brain of a Patient with Visual Agnosia
 Data Used to Analyze Productivity in Country 1 and Country 2