|
|
|

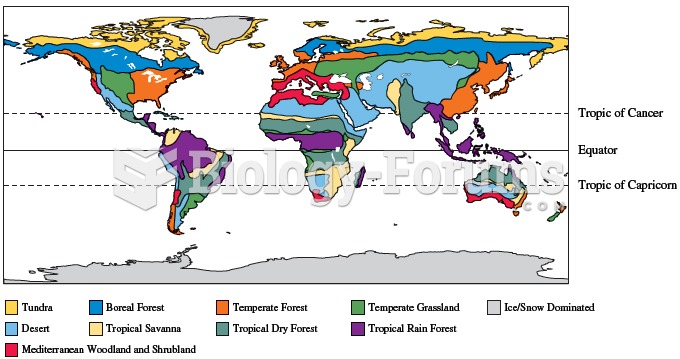 Variation in climatic conditions result in geographic variation in the distribution of biome types a
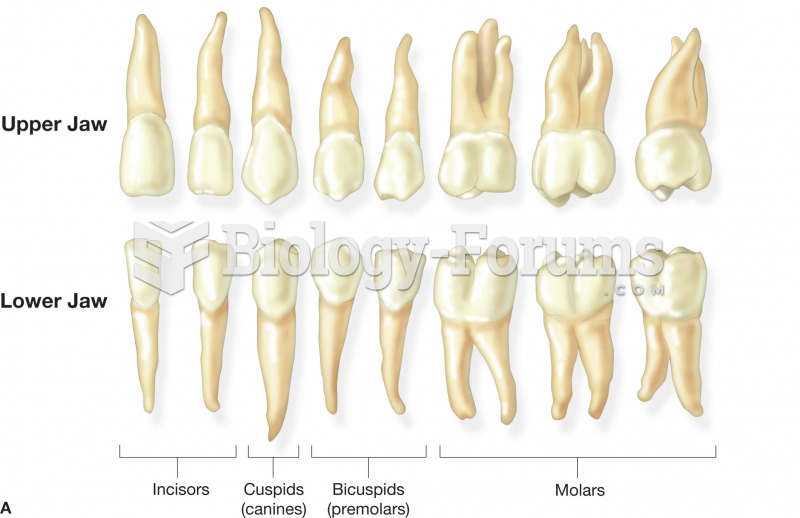 (A) The name and shape of the adult teeth. These teeth represent those found in the right side of th
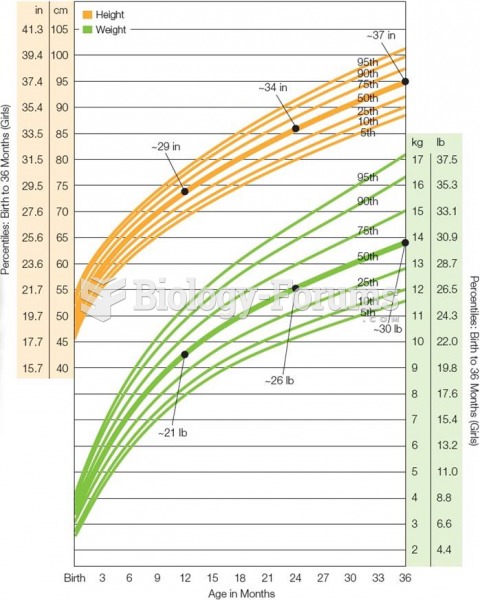 Growth Chart for American Girls From Birth Through Age 3 Growth slows from infancy to toddlerhood b
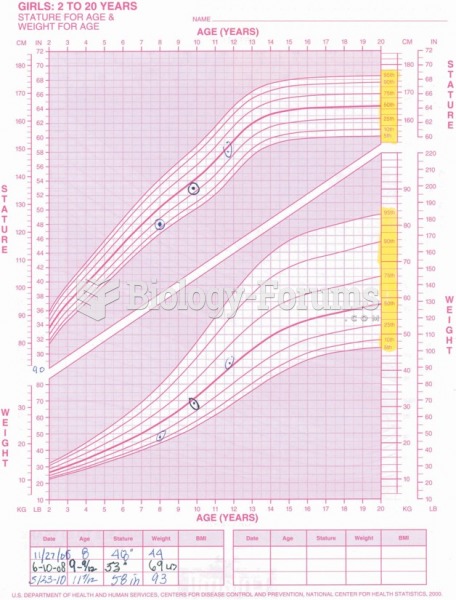 This pediatric growth chart tracks the height and weight for girls ages 2–20.
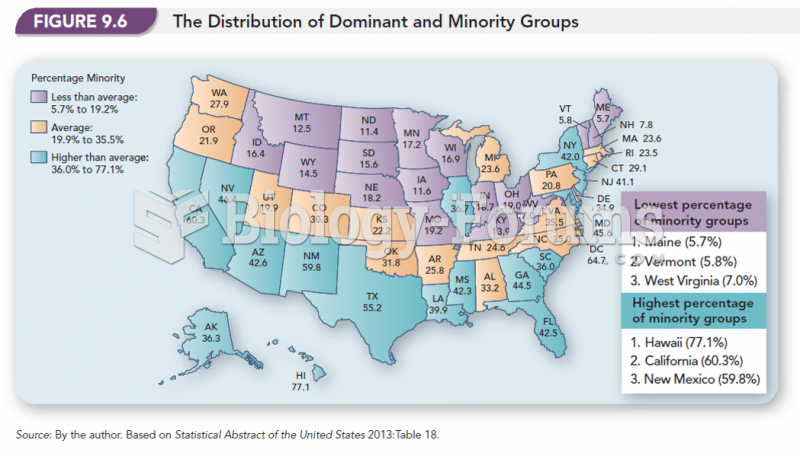 The Distribution of Dominant and Minority Groups
 Correlation Coefficient, r (Chart)