The following plot is a Levey-Jennings chart.
Which of the following is true about the data point noted by the arrow?
A) It indicates a shift has occurred.
B) It is an outlier.
C) It suggests the data are trending downward.
D) None of the above
Question 2
What does the term equivalent weight mean?
A) The amount of a solute that is equivalent in mass to 1 mole of the intended solvent
B) The amount of a substance that contains, theoretically combines with, or theoretically replaces 1 mole of hydrogen atoms
C) The molality of a solute that contains the same number of atoms as 100 grams of solvent
D) The molarity of a solute that is necessary to completely saturate 100 mL of solvent

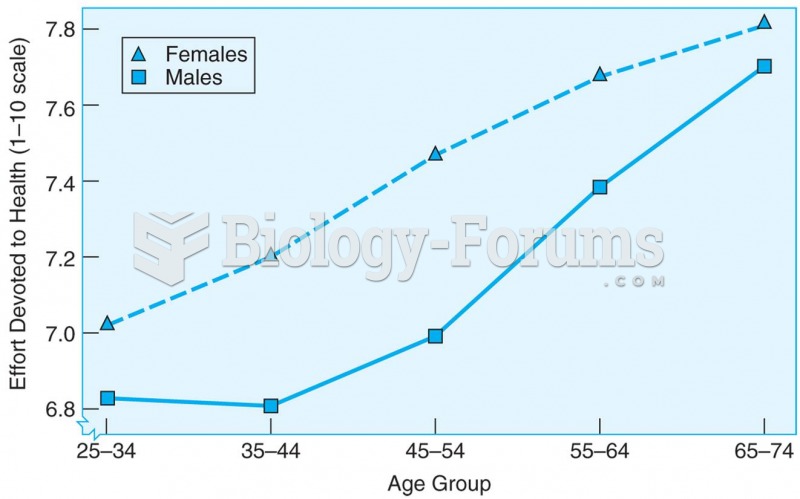 Cross-sectional data showing that the amount of effort spent on personal health care increases with
 All messages must be documented and placed in the patient's chart.
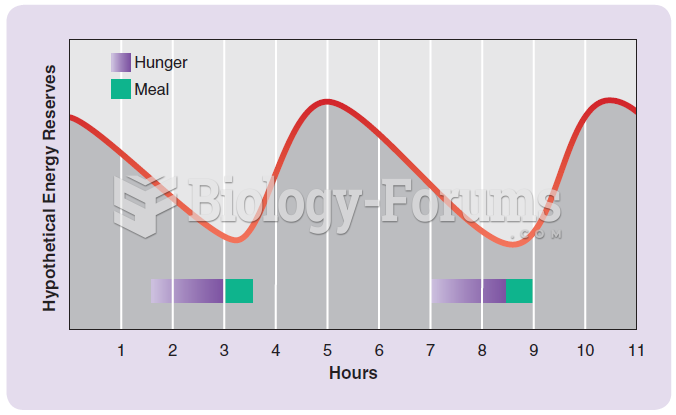 The energy set-point view that is the basis of many people’s thinking about hunger and eating.
 How to find the quartiles and percentiles for a data set
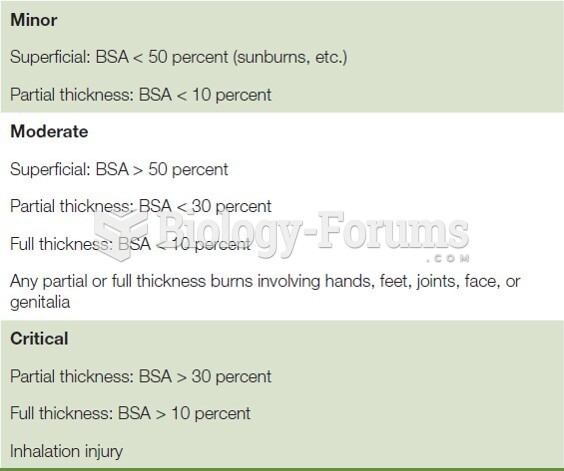 Burn Severity Chart
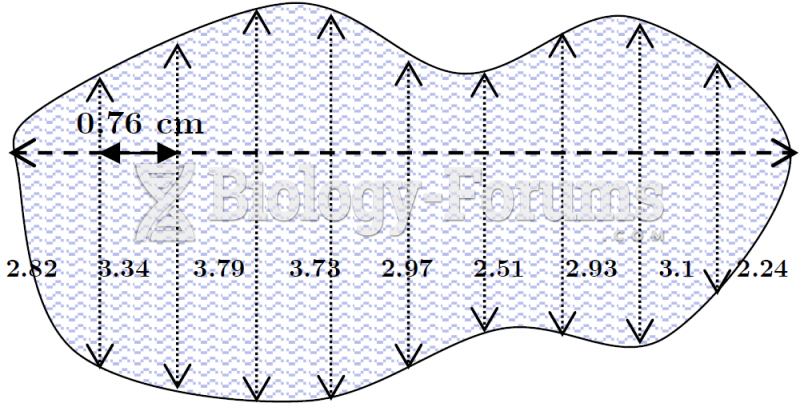 Offset Method Plot of Land with Measurements