The following plot is a Levey-Jennings chart.
Which of the following is true about the data point noted by the arrow?
A) It indicates a shift has occurred.
B) It is an outlier.
C) It suggests the data are trending downward.
D) None of the above
Question 2
What does the term equivalent weight mean?
A) The amount of a solute that is equivalent in mass to 1 mole of the intended solvent
B) The amount of a substance that contains, theoretically combines with, or theoretically replaces 1 mole of hydrogen atoms
C) The molality of a solute that contains the same number of atoms as 100 grams of solvent
D) The molarity of a solute that is necessary to completely saturate 100 mL of solvent

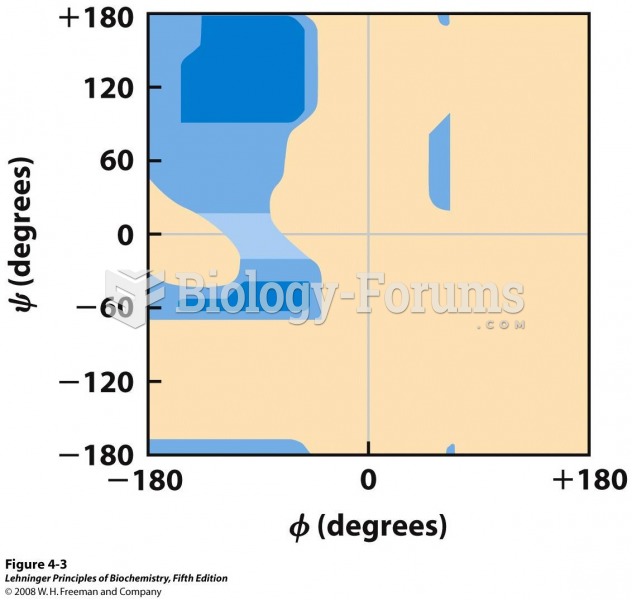 Ramachandran plot for L-Ala residues
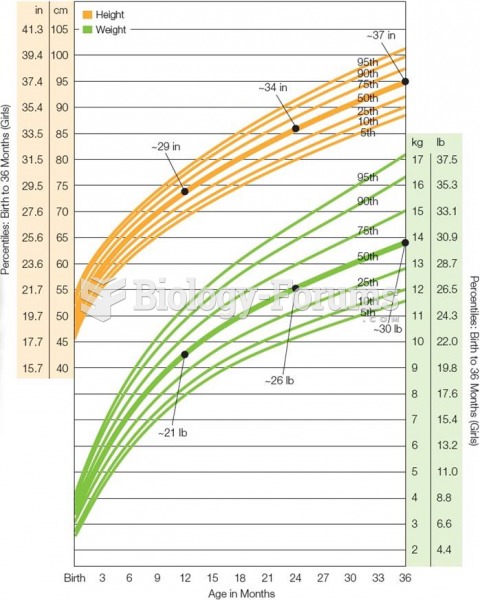 Growth Chart for American Girls From Birth Through Age 3 Growth slows from infancy to toddlerhood b
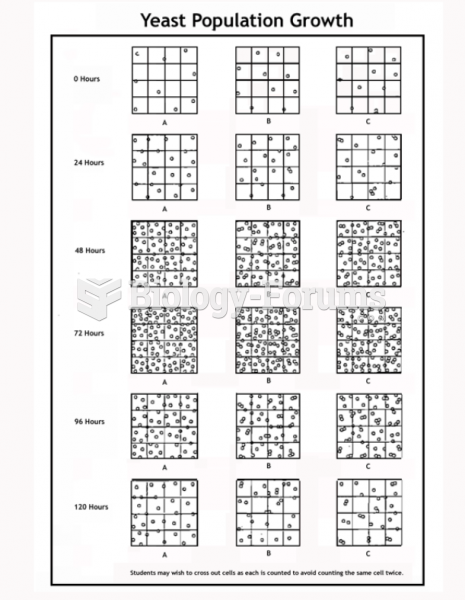 Bio Chart
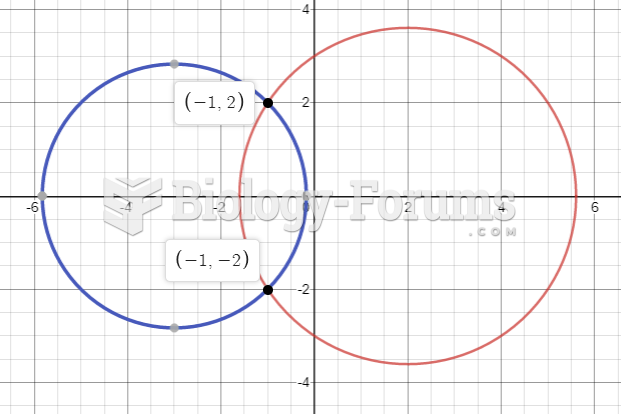 Point of Intersection of 2 Circles
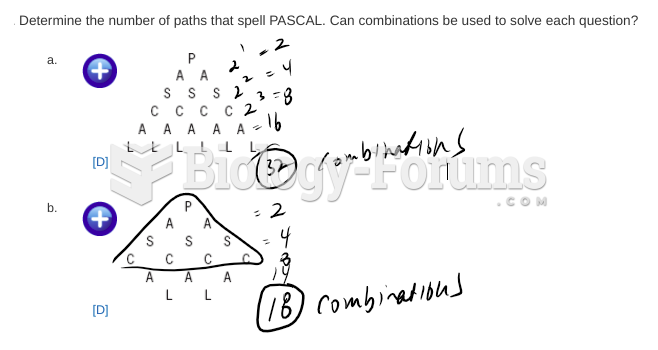 Data management questions
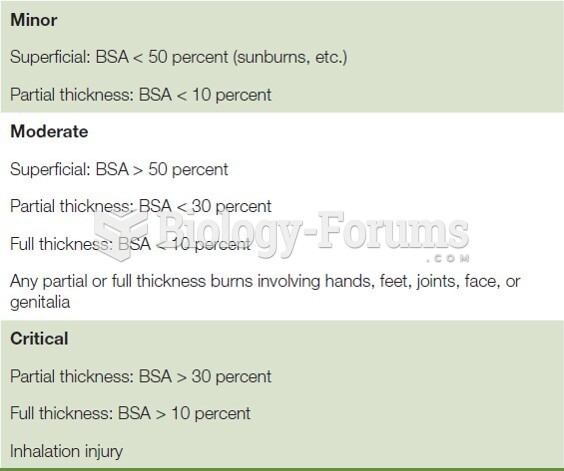 Burn Severity Chart