The following plot is a Levey-Jennings chart.
Which of the following is true about the data point noted by the arrow?
A) It indicates a shift has occurred.
B) It is an outlier.
C) It suggests the data are trending downward.
D) None of the above
Question 2
What does the term equivalent weight mean?
A) The amount of a solute that is equivalent in mass to 1 mole of the intended solvent
B) The amount of a substance that contains, theoretically combines with, or theoretically replaces 1 mole of hydrogen atoms
C) The molality of a solute that contains the same number of atoms as 100 grams of solvent
D) The molarity of a solute that is necessary to completely saturate 100 mL of solvent

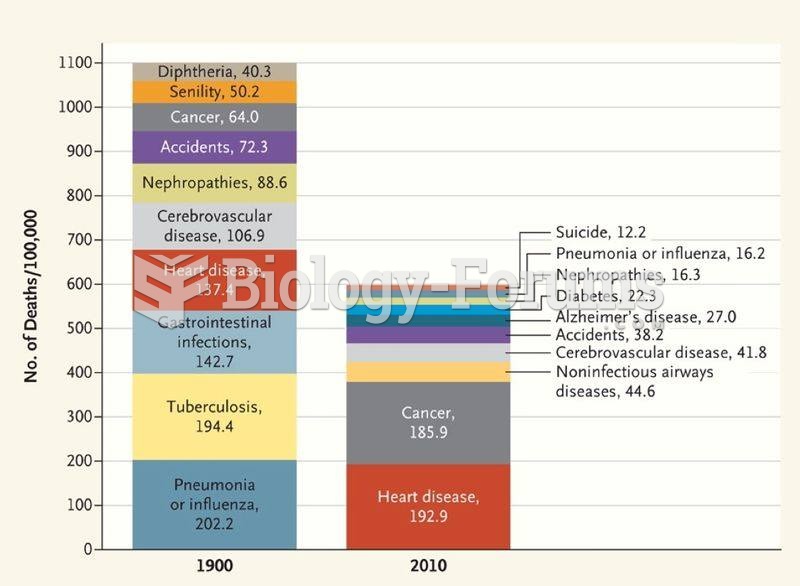 Morbidity chart
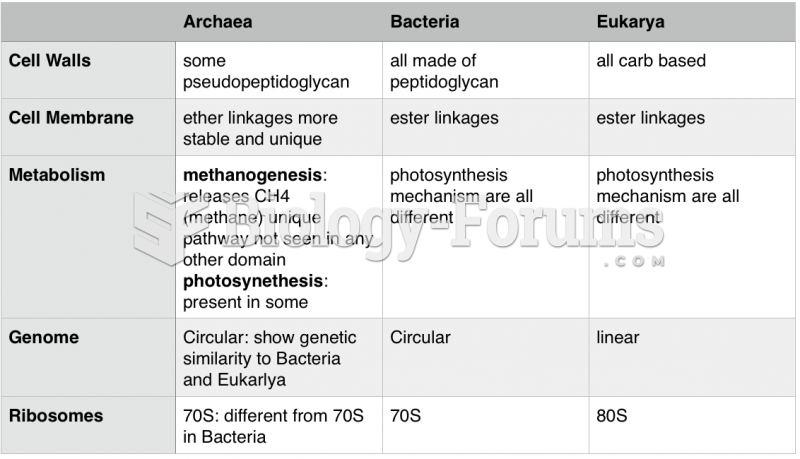 Archaea, Eukarya, Bacteria Differences Chart
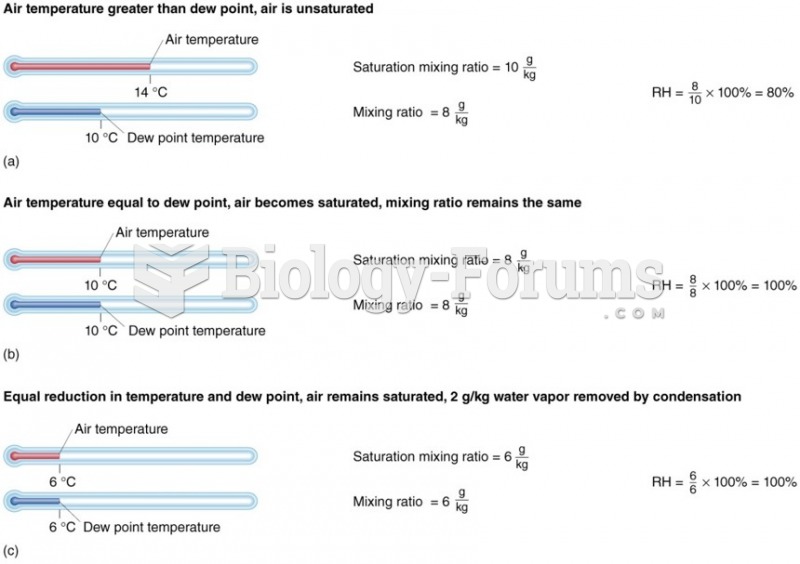 Dew point/temperature relationships in (a) unsaturated air and saturated air (b and c).
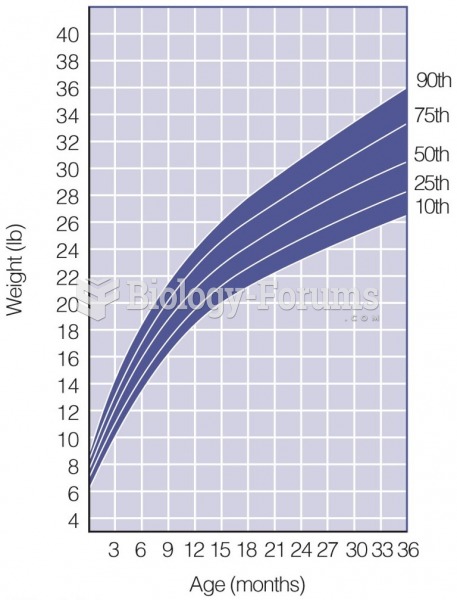 Growth Chart
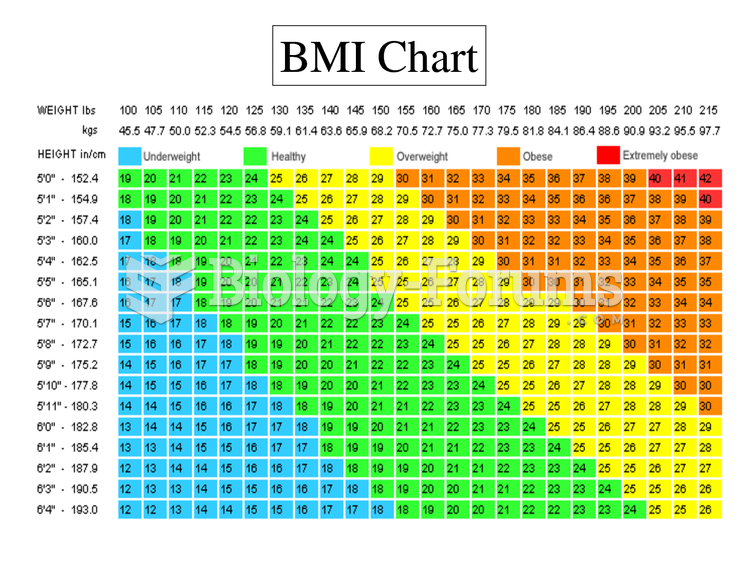 BMI Chart Weight Chart
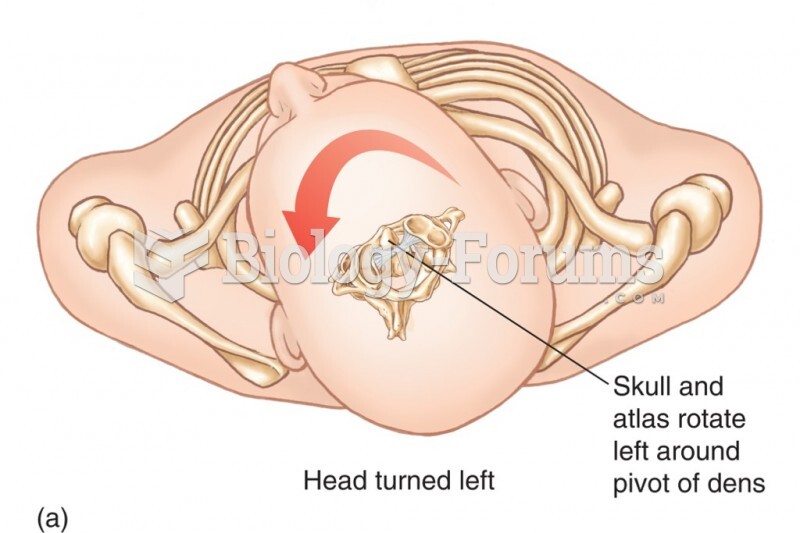 Relationship Between the Atlas and the Axis. The Dens of the Axis Provides a Pivotal Point Around Wh