The following plot is a Levey-Jennings chart.
Which of the following is true about the data point noted by the arrow?
A) It indicates a shift has occurred.
B) It is an outlier.
C) It suggests the data are trending downward.
D) None of the above
Question 2
What does the term equivalent weight mean?
A) The amount of a solute that is equivalent in mass to 1 mole of the intended solvent
B) The amount of a substance that contains, theoretically combines with, or theoretically replaces 1 mole of hydrogen atoms
C) The molality of a solute that contains the same number of atoms as 100 grams of solvent
D) The molarity of a solute that is necessary to completely saturate 100 mL of solvent

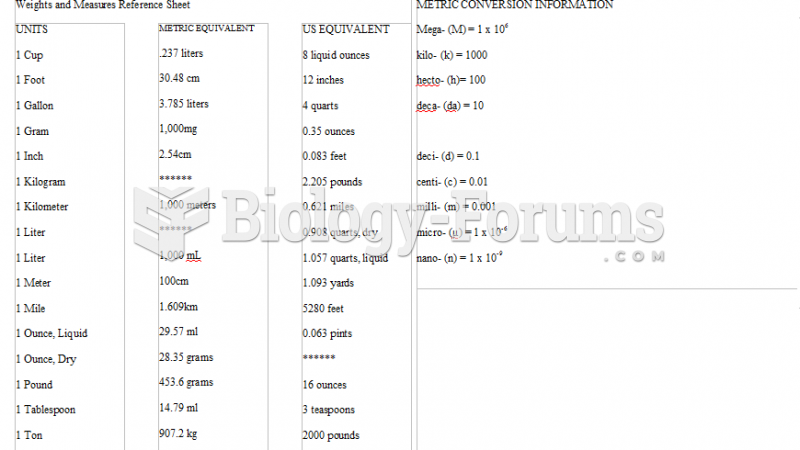 Conversion Chart
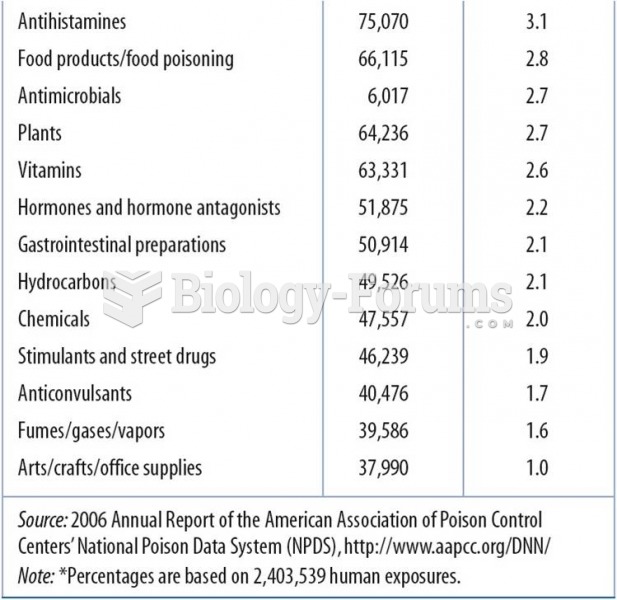 2006 Data:Top 25 Substances Involved in Human Exposures
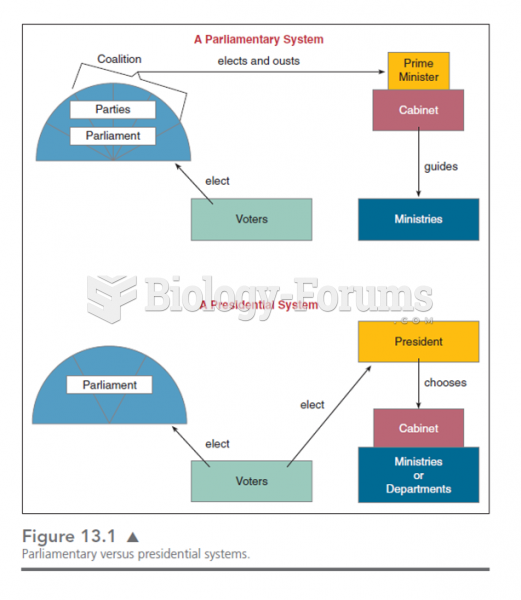 This chart shows the various lines of responsibility and how they differ in presidential and parliam
 A typical OBD-II data link connector (DLC). The location varies with make and model and may even be ...
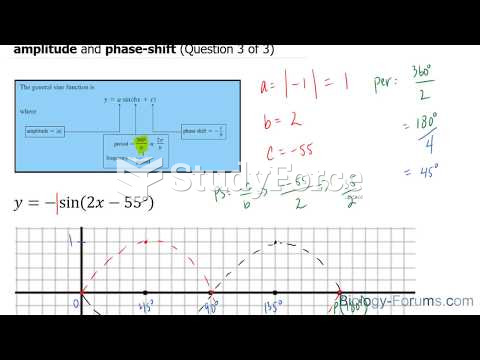 How to plot a sine function with a negative amplitude and phase shift (Question 3 of 3)
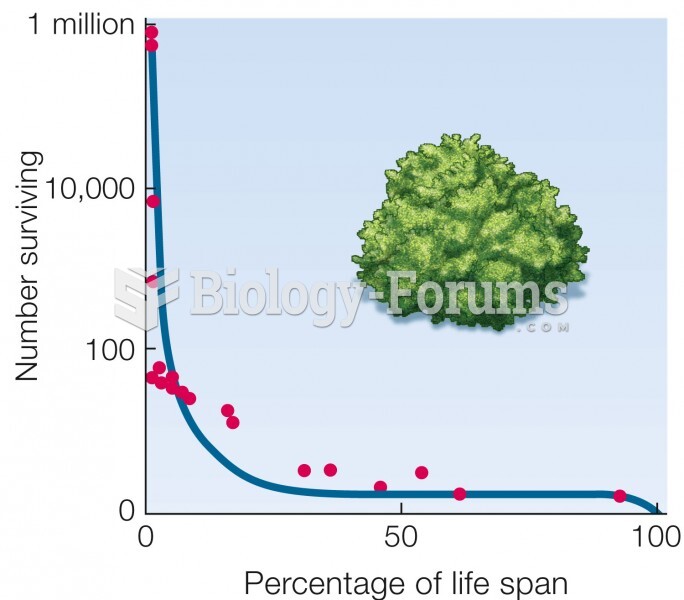 Type III curve. Mortality is highest early in life. Data for a desert shrub (Cleome droserifolia).