|
|
|

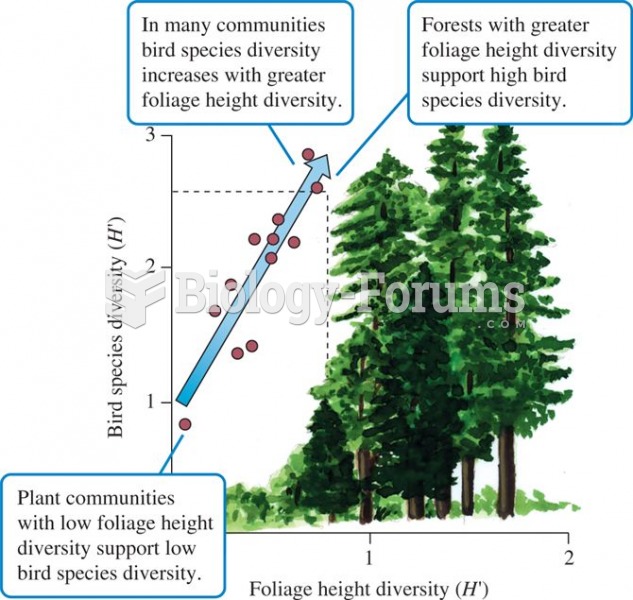 Foliage height diversity and bird species diversity (data from MacArthur and MacArthur 1961).
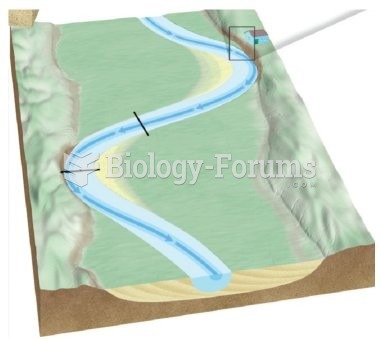 Label the cutbank and point bar on this image.
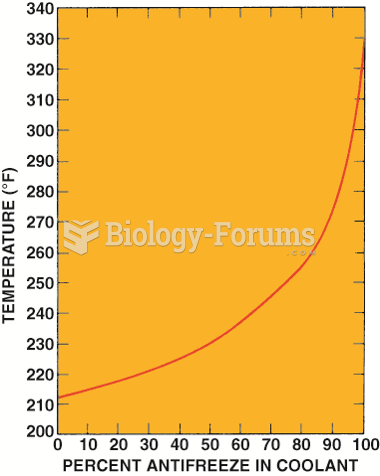 Graph showing how the boiling point of the coolant increases as the percentage of antifreeze in ...
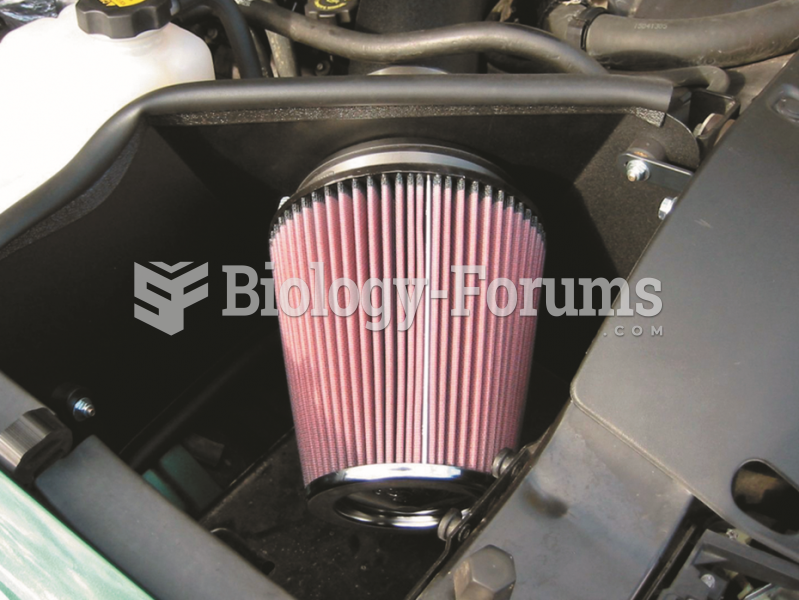 A high-performance aftermarket air filter often can increase airflow into the engine for more ...
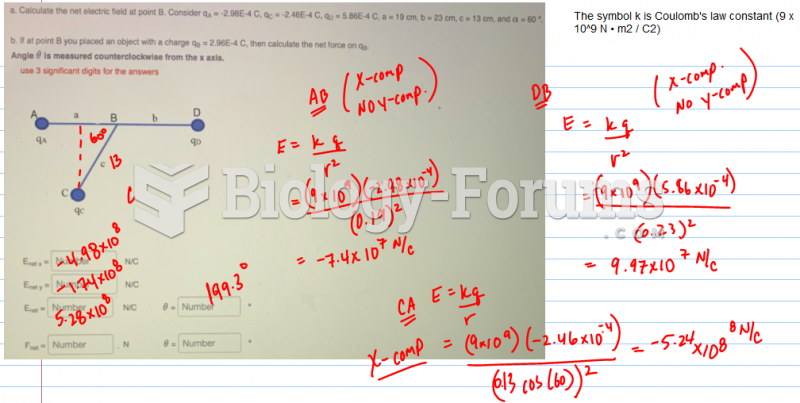 . Calculate the net electric field at point B
 Chi-Square Analysis of Mendel’s Trihybrid-Cross Data