This topic contains a solution. Click here to go to the answer
|
|
|

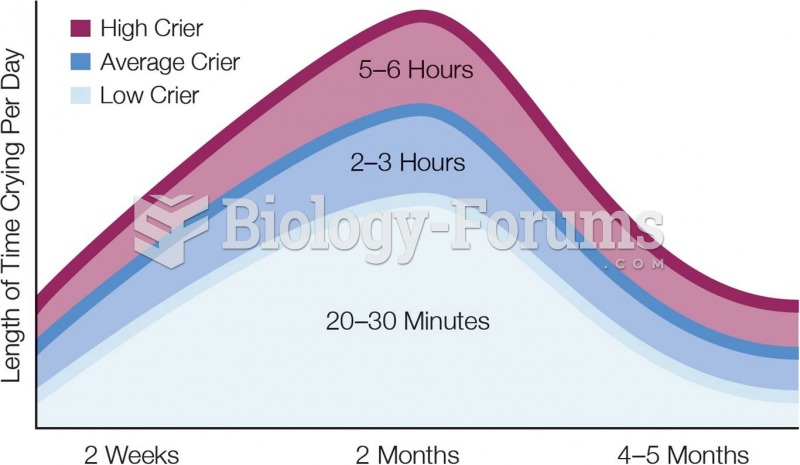 Crying Frequency in the Early Months In their first months of life, infants often cry for no appare
 Bell Curve for Intelligence IQ scores for a population-based sample usually fall into this kind of
 Dew point/temperature relationships in (a) unsaturated air and saturated air (b and c).
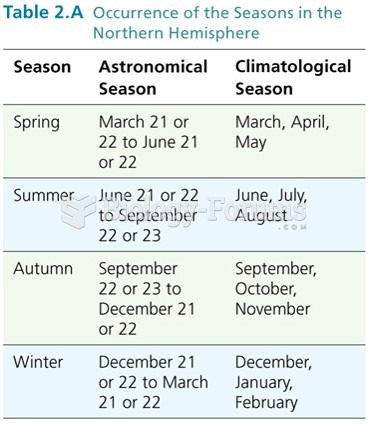 Occurrence of the Seasons in the Northern Hemisphere
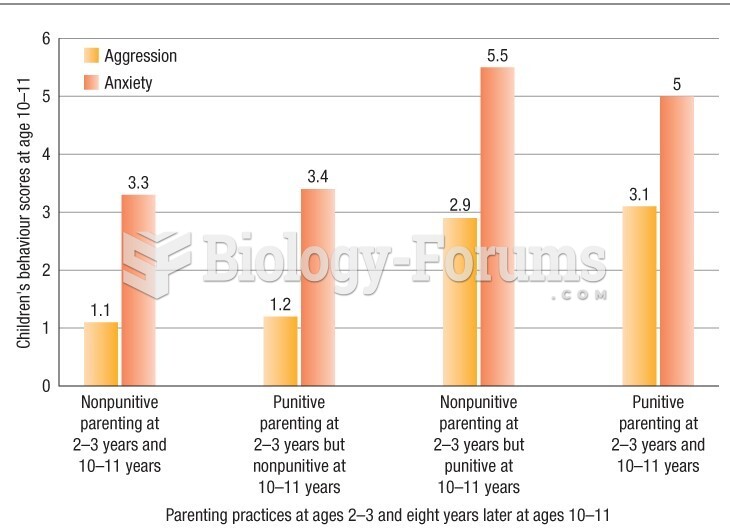 Children's behaviour rating scores on measures of aggression and anxiety
 The consequences of the intensity of natural selection on allele frequency.