This topic contains a solution. Click here to go to the answer
|
|
|

 A health history is essential in collecting subjective data about metabolic acidosis.
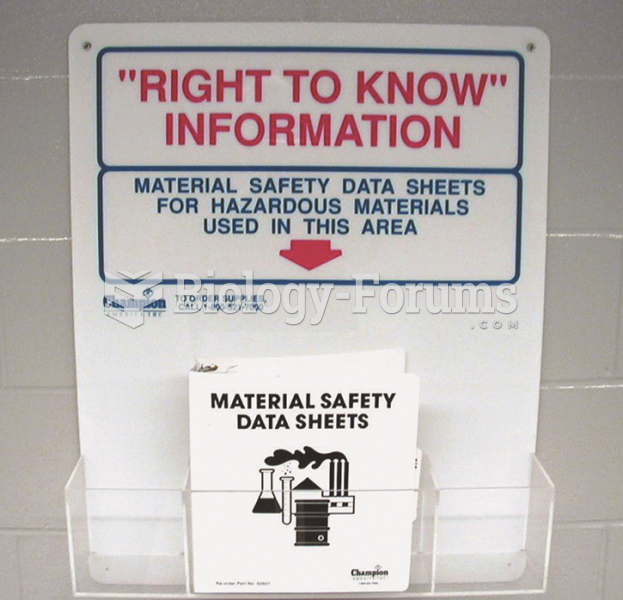 Material safety data sheets (MSDS), now called safety data sheets (SDS), should be readily available ...
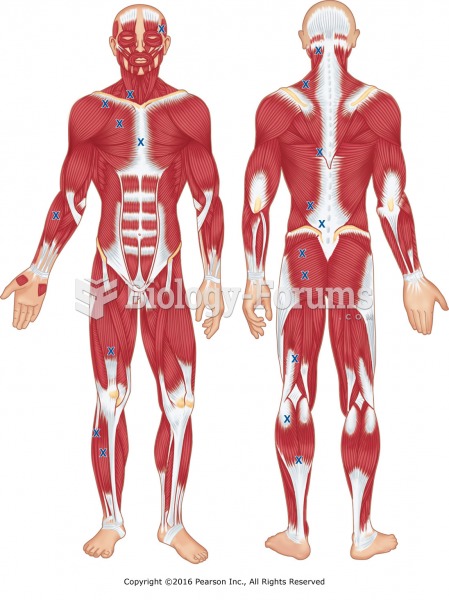 Common trigger point locations, anterior and posterior.
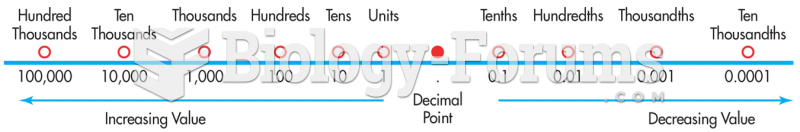 Decimal Values as They Relate to the Location of the Decimal Point
 The same pair of homologs, but with no exchange occurring between them
 Chi-Square Analysis of Mendel’s Trihybrid-Cross Data