This topic contains a solution. Click here to go to the answer
|
|
|

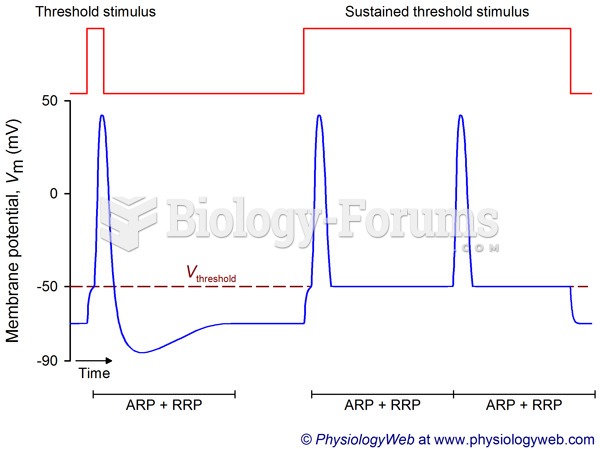 Frequency coding in the nervous system: Threshold stimulus.
 Label the cutbank and point bar on this image.
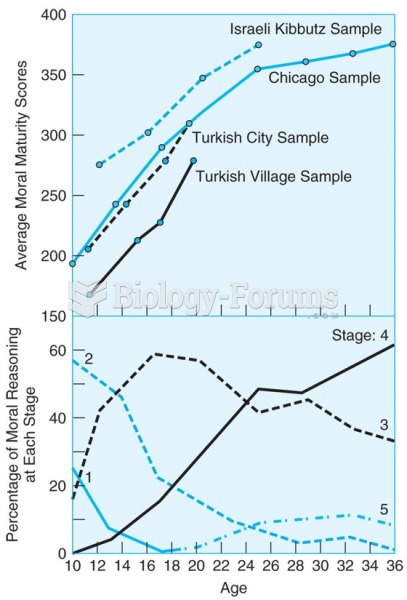 The upper panel shows that scores of four diverse samples of boys on a moral reasoning test show a ...
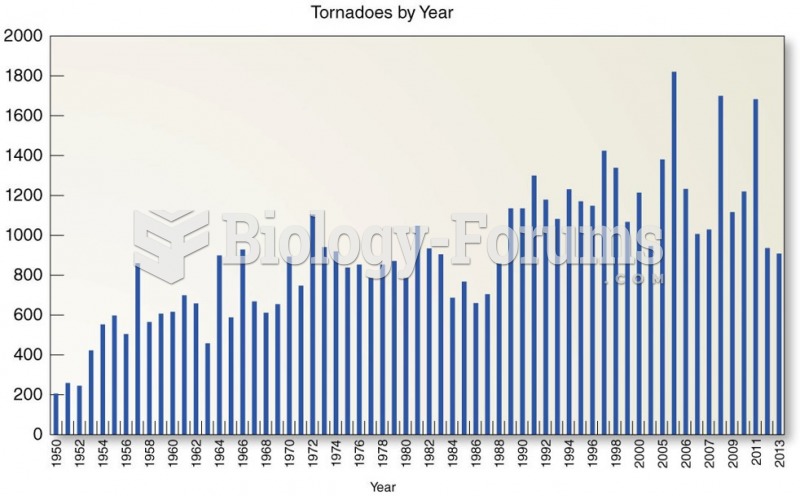 Trends in U.S. Tornado Occurrence
 Set-Point Theory