|
|
|

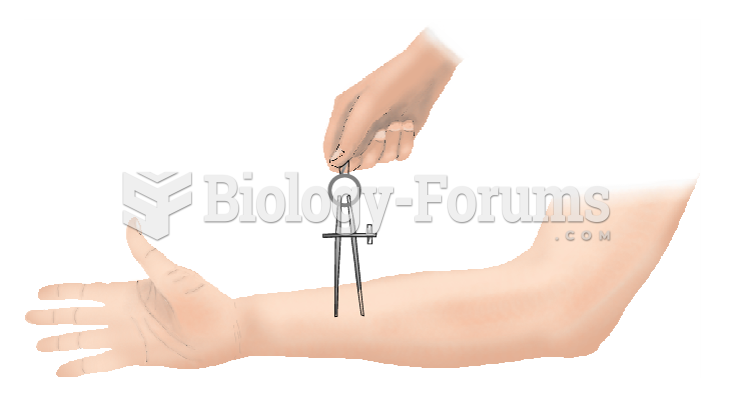 The Method for Determining the Two-Point Discrimination Threshold
 How to find the quartiles and percentiles for a data set
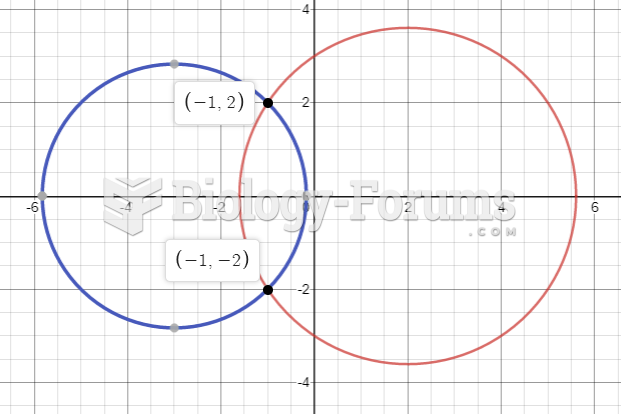 Point of Intersection of 2 Circles
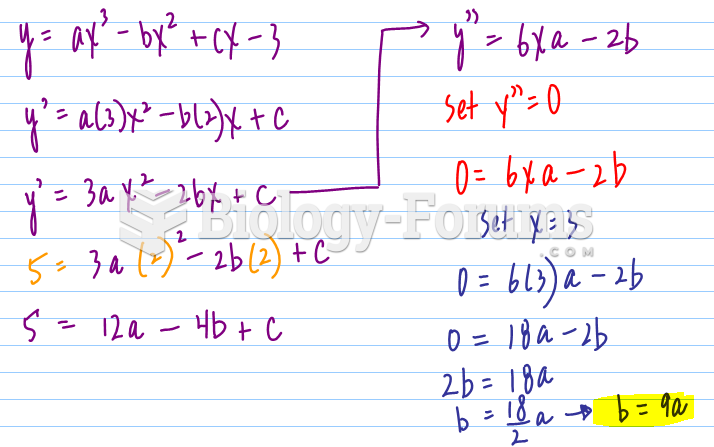 The slope of the curve y = ax^3 - bx^2 + cx - 3 at x = 2 is 5. If the point of inflection of the cur
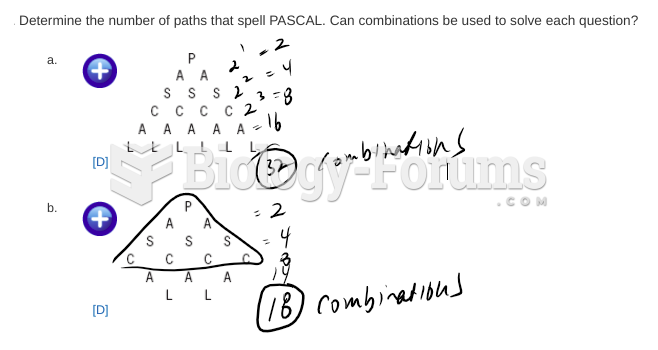 Data management questions
 Plot of land (Part a)