|
|
|

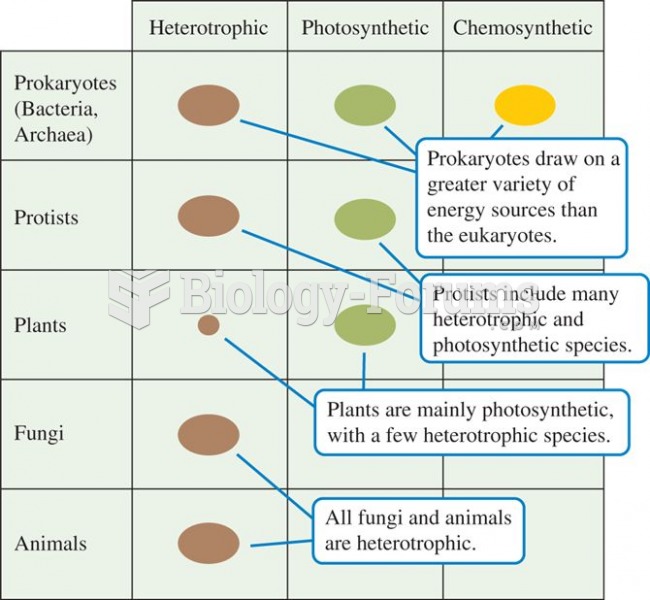 A plot of trophic diversity across the major groups of organisms shows highest trophic diversity amo
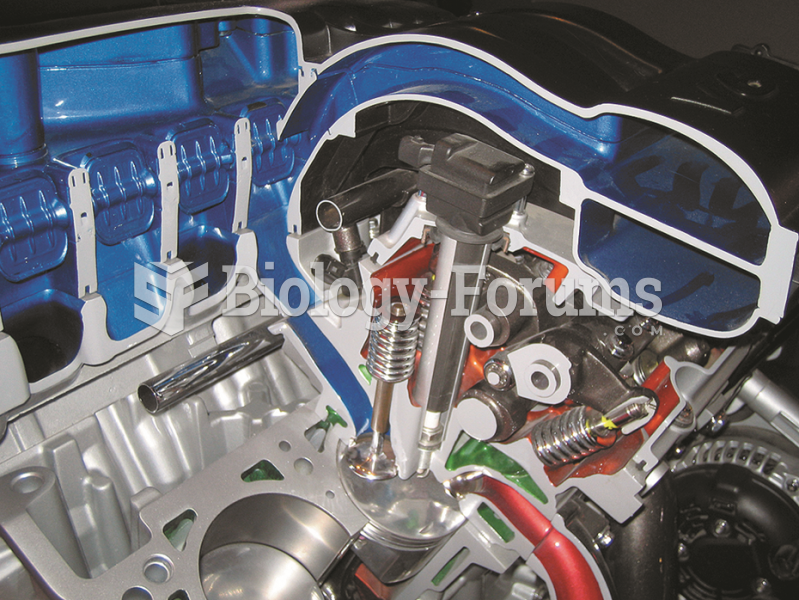 The air flowing into the engine can be directed through long or short runners for best performance ...
 Ischemic compression (i.e., direct pressure) to a trigger point in the trapezius muscle.
 Direct thumb pressure to a trigger point.
 Demographic Data for Nigeria
 Summary of the effects on transcription levels of different point mutations