This topic contains a solution. Click here to go to the answer
|
|
|

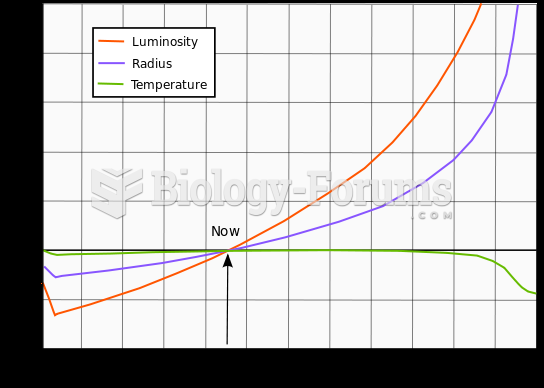 Evolution of the Sun's luminosity, radius and effective temperature compared to the present Sun
 A Total Eclipse of the Sun
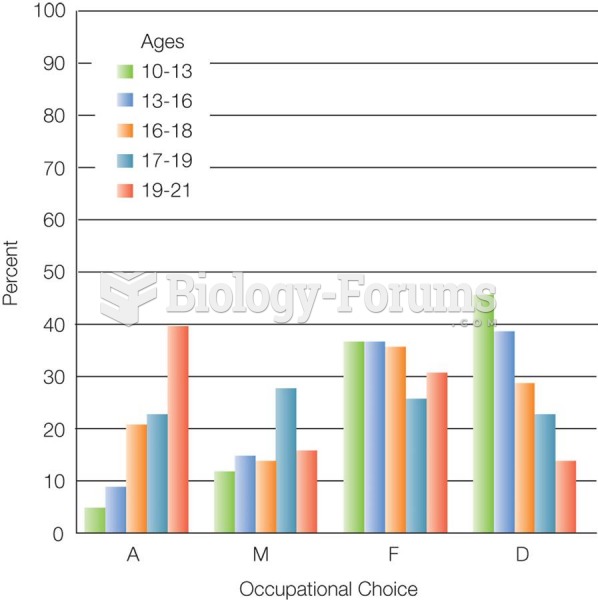 U.S. Study on Identity Achievement With age, more young people are classified in identity achieveme
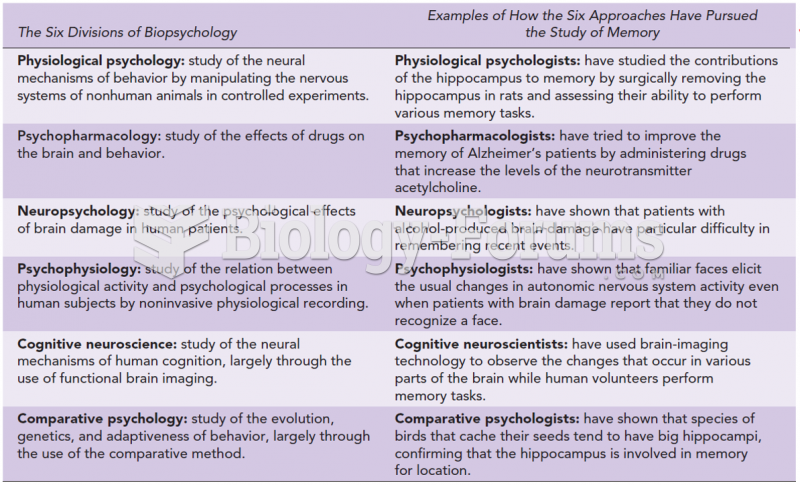 The Six Major Divisions of Biopsychology, with Examples of How They Have Approached the Study of ...
 Reconstructed West Front of the Altar from Pergamon (In Present-day Turkey)
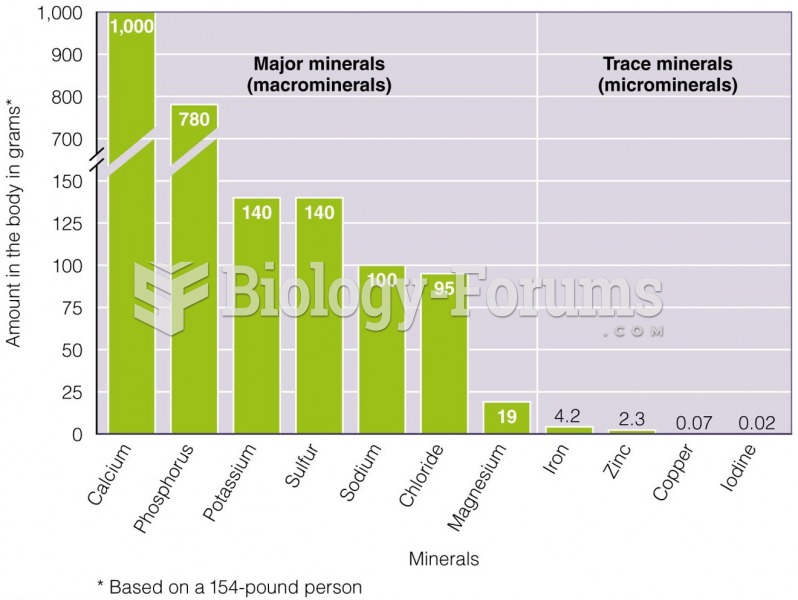 The Amounts of the Different Minerals in Your Body The major minerals are present in larger amounts