This topic contains a solution. Click here to go to the answer
|
|
|

 Biology deals with the study of the many varieties of living organisms.
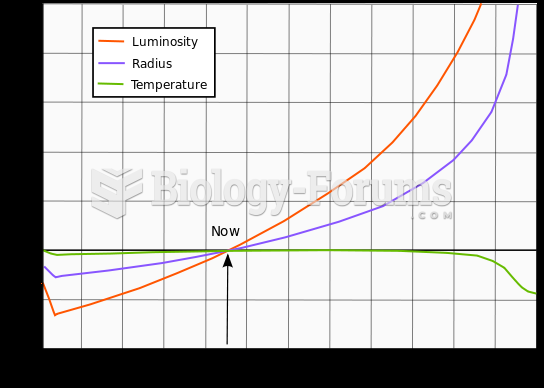 Evolution of the Sun's luminosity, radius and effective temperature compared to the present Sun
 Results of Tracing Methods
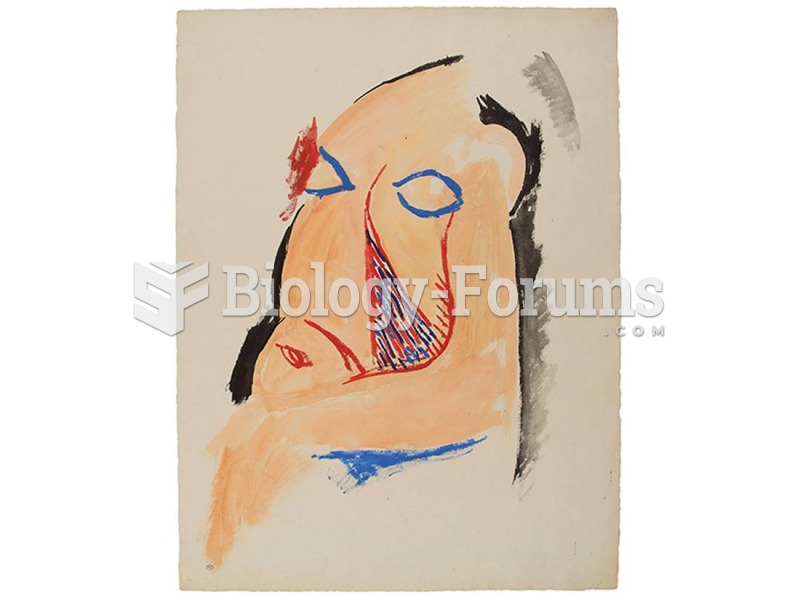 Pablo Picasso, Study for Les Demoiselles d'Avignon: Head of the Squatting Demoiselle
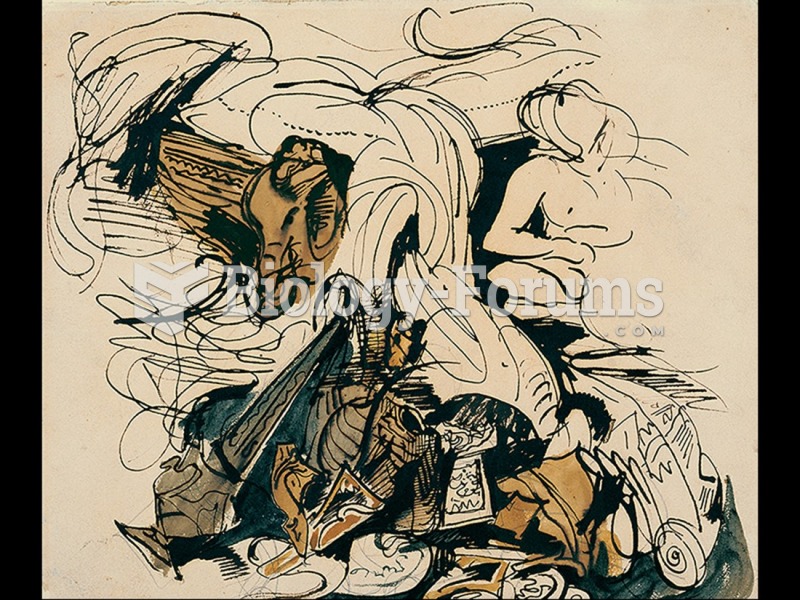 Eugène Delacroix, Study for The Death of Sardanapalus.
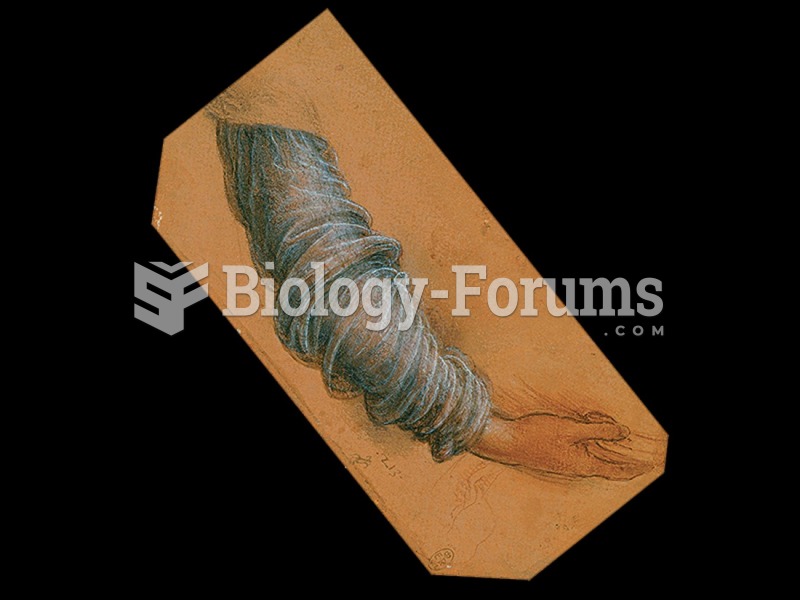 Leonardo da Vinci, Study for a Sleeve.