This topic contains a solution. Click here to go to the answer
|
|
|

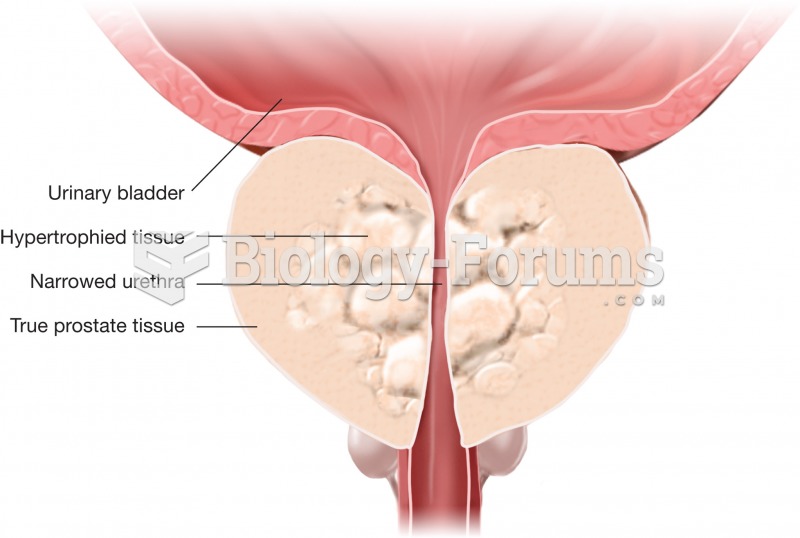 Benign prostatic hyperplasia. The condition results when an inner capsule of nonfunctional prostate
 The continents were not always in their present positions. The position of the continents is importa
 Cultural Variations in the Strange Situation Across cultures, most toddlers exhibit secure attachme
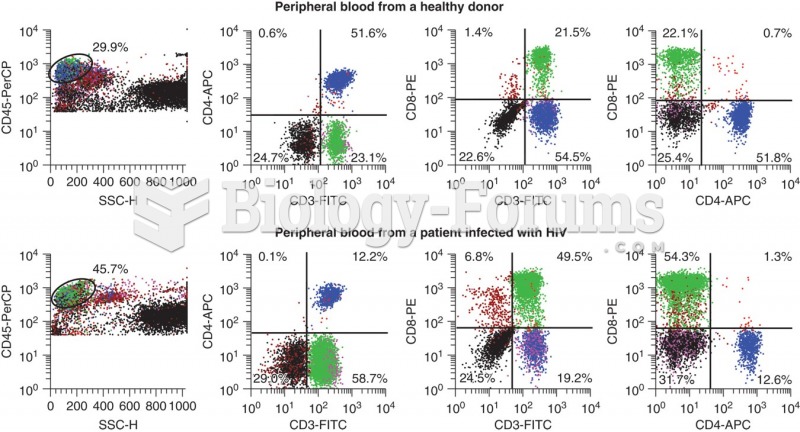 Flow scattergrams showing results on the top set from a healthy donor and on the bottom set from a ...
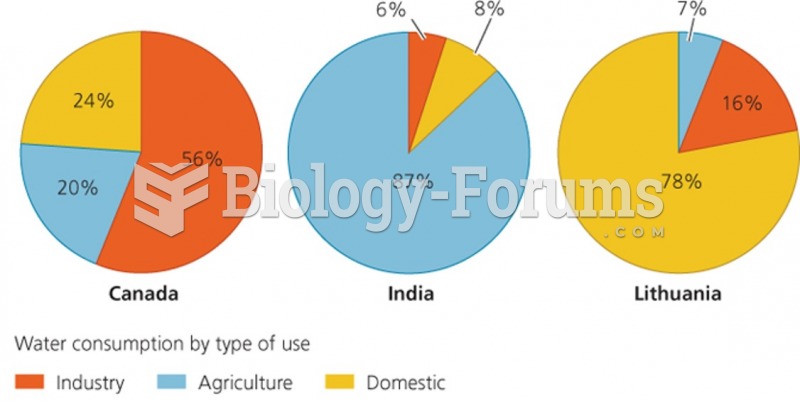 Water consumption by type of use
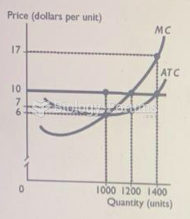 Juan's Software Service Company is in a perfectly competitive market. Juan has total fixed ...