An analyst wishing to show the fluctuations in coffee consumption by month over the past two years should probably use a:
a. grouped bar chart.
b. pie chart.
c. line chart.
d. stratum chart.
e. divided bar chart.
Question 2
Which of the following is FALSE about charts in the research report?
a. The pie chart can be used to depict changing trends over time.
b. The line chart is a two-dimensional chart that is particularly useful in depicting dynamic relationships such as time-series fluctuations of one or more series.
c. The stratum chart is in some ways a dynamic pie chart in that it can be used to show relative emphasis by sector and how the relative emphasis is changing with time.
d. The stratum chart is essentially a set of line charts whose quantities are aggregated or a total that is disaggregated.
e. A pictogram is a variation of a bar chart.

 The actions of Frzb and the Frizzled receptor protein show how embryonic development represents a ba
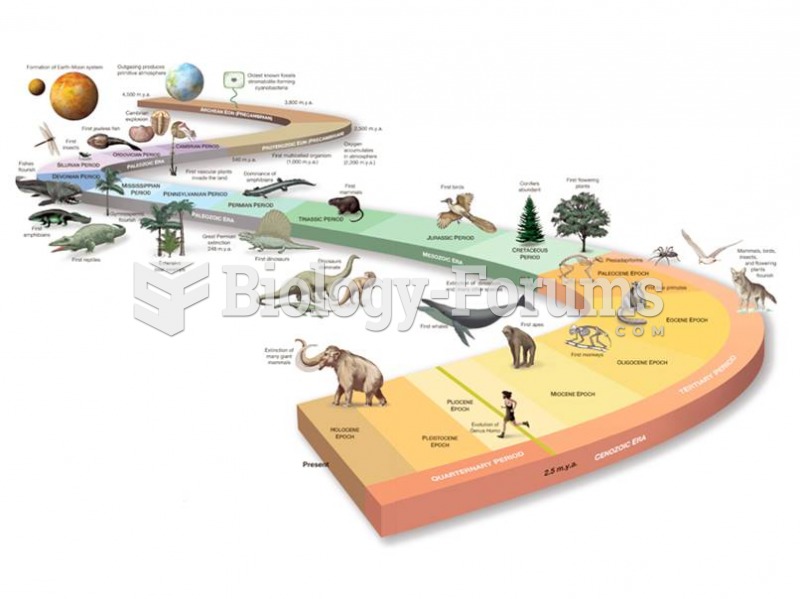 Earth’s history spans 4.5 billion years. Geologists and paleontologists have pieced together the his
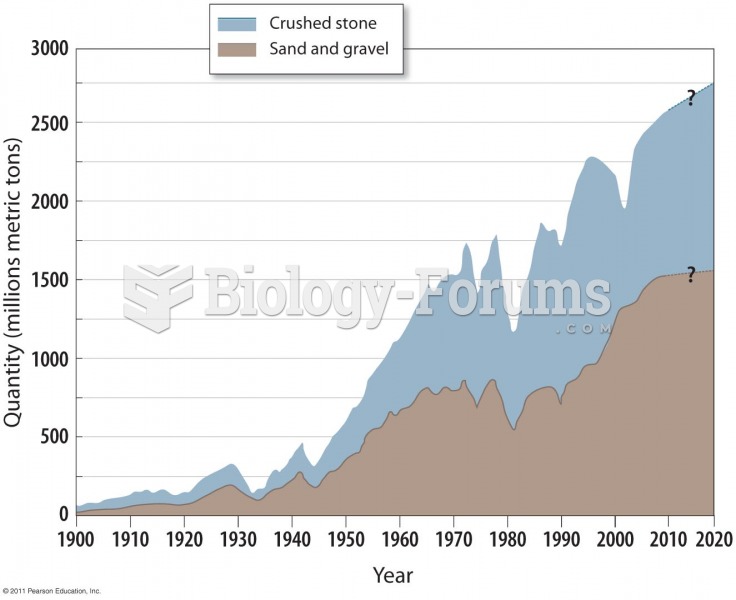 Past and Future Use of Aggregate
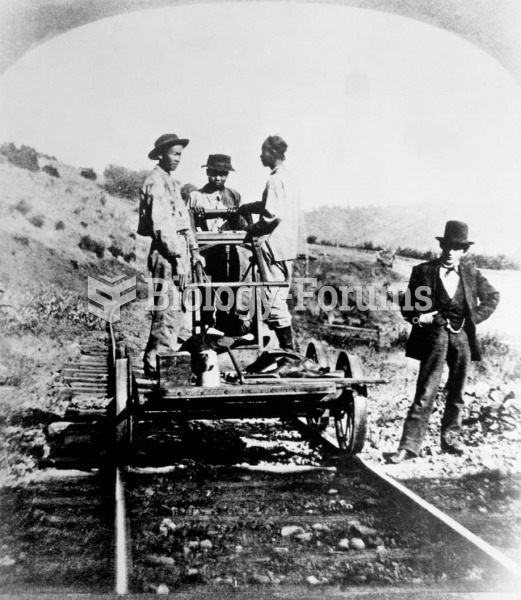 Chinese workers on a railway in the far West. “Without them,” Leland Stanford, president of the Cent
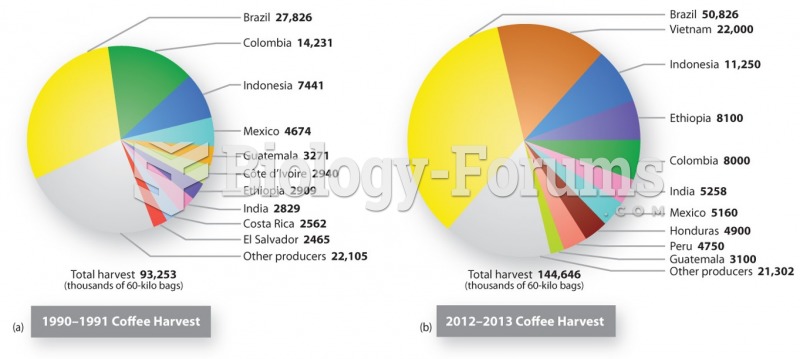 Global Coffee Production
 Fetal development from 1 month to 9 months