An analyst wishing to show the fluctuations in coffee consumption by month over the past two years should probably use a:
a. grouped bar chart.
b. pie chart.
c. line chart.
d. stratum chart.
e. divided bar chart.
Question 2
Which of the following is FALSE about charts in the research report?
a. The pie chart can be used to depict changing trends over time.
b. The line chart is a two-dimensional chart that is particularly useful in depicting dynamic relationships such as time-series fluctuations of one or more series.
c. The stratum chart is in some ways a dynamic pie chart in that it can be used to show relative emphasis by sector and how the relative emphasis is changing with time.
d. The stratum chart is essentially a set of line charts whose quantities are aggregated or a total that is disaggregated.
e. A pictogram is a variation of a bar chart.

 Toddler: 1–3 years.
 Review Cognitive Changes over the Adult Years
 “Career choice” for many women means leaving their paid jobs for a number of years when they ...
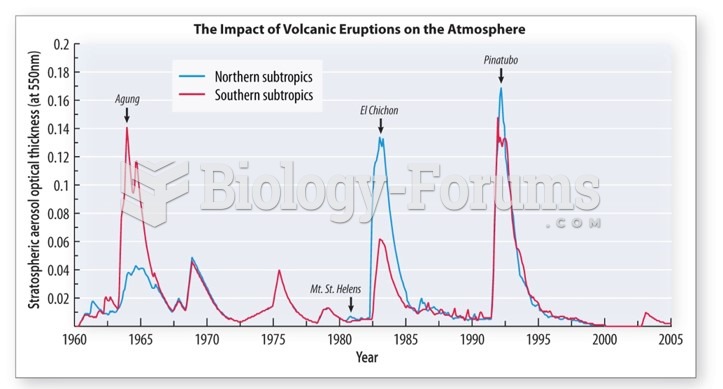 Mount Pinatubo caused ~1˚C cooling for up to 5 years
 Portion sizes of French fries have more than doubled from the past
 Heart drawing by 6 years old