|
|
|

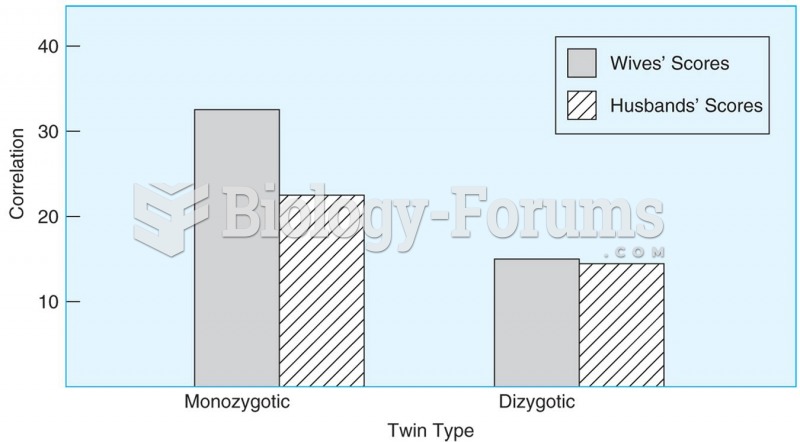 Women who are monozygotic twins and have the same genes are more similar in their marital happiness
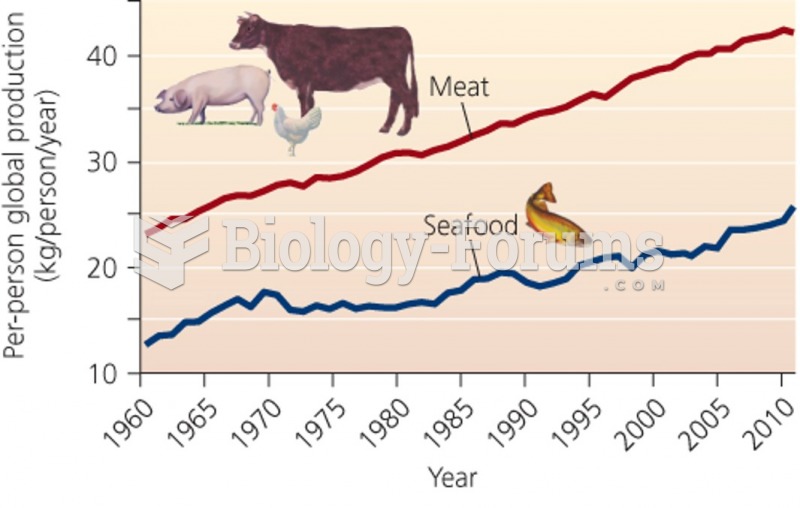 Consumption of animal products "استهلاك المنتجات الحيوانية"
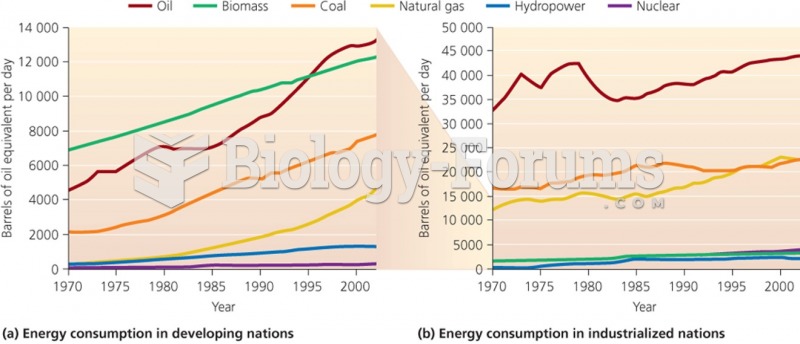 Comparison of energy consumption in developing and industrialized nations
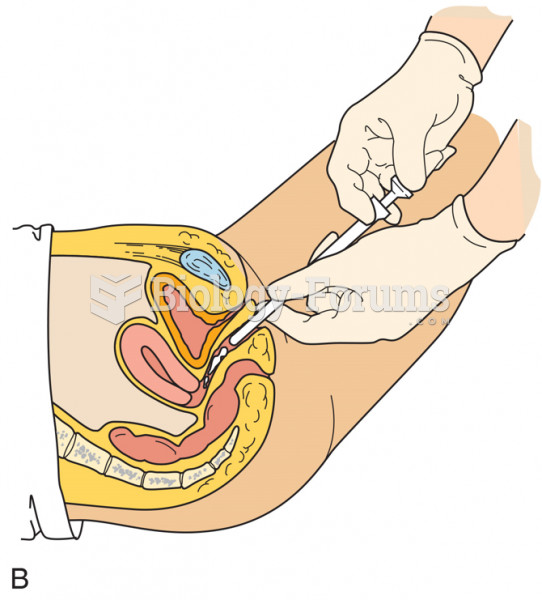 Instilling Vaginal Cream by Using an Applicator
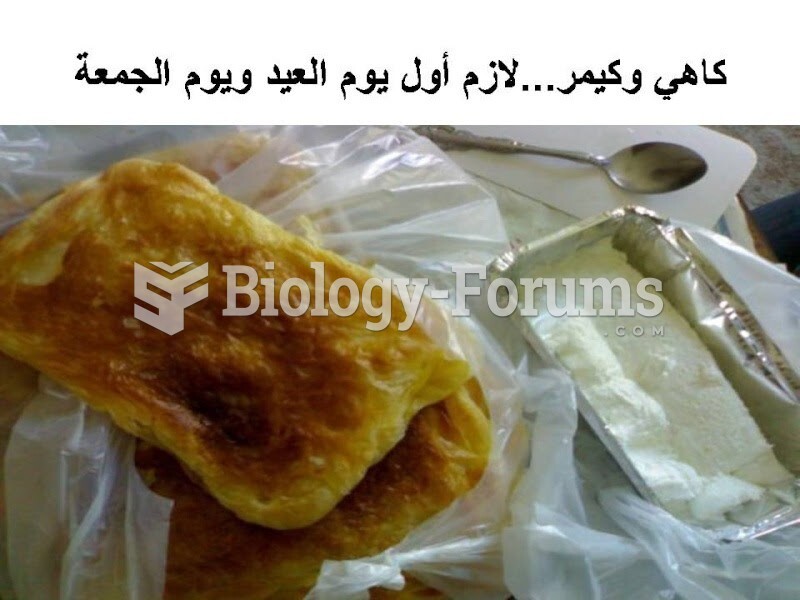 Geymar with Kahi (Iraqi clotted cream)
 Depictions of the transformations leading to the supercoiling of circular DNA