|
|
|

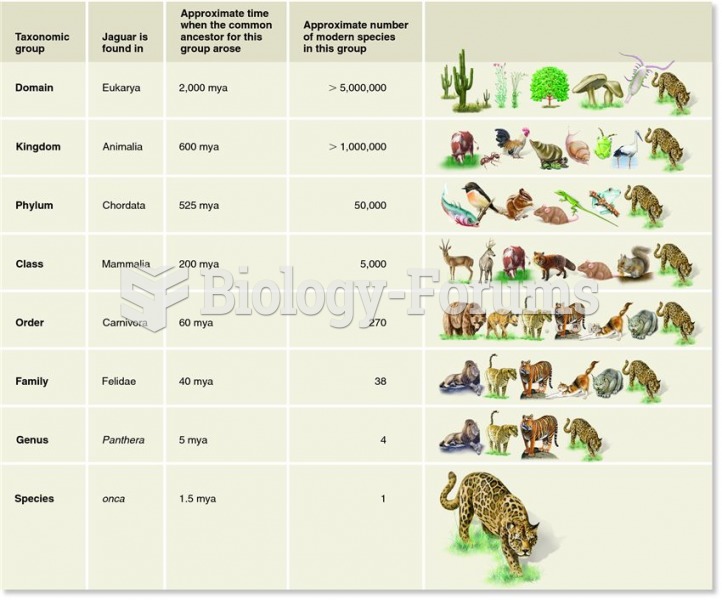 Taxonomic and evolutionary groupings leading to the jaguar
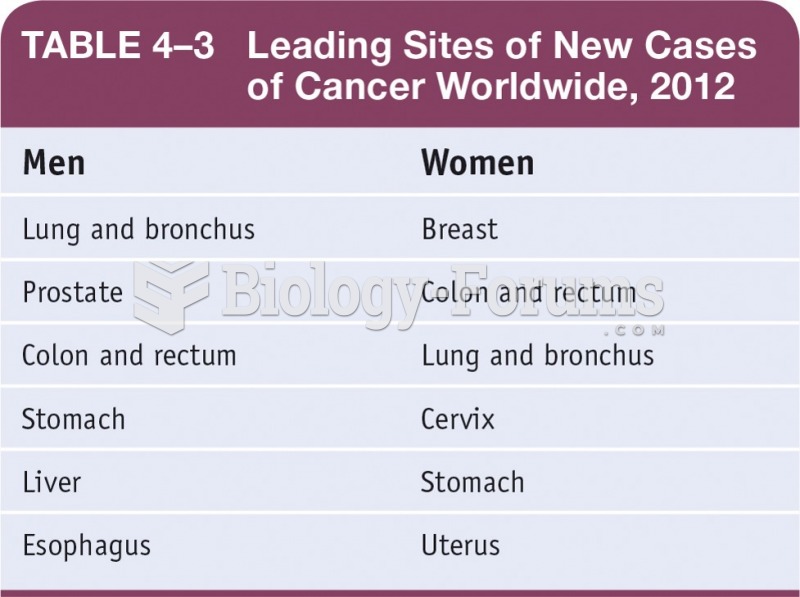 Leading Sites of New Cases of Cancer Worldwide, 2012
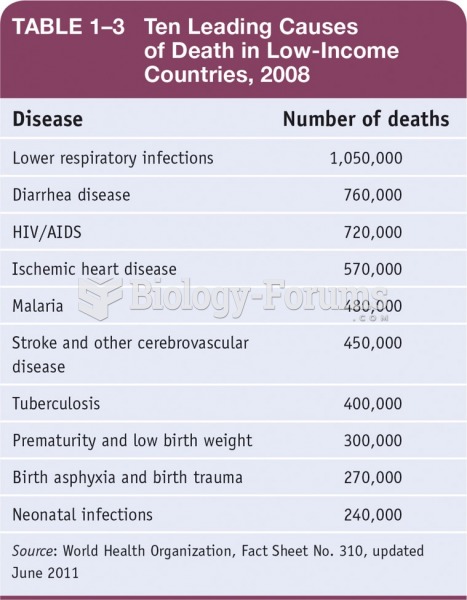 Ten Leading Causes of Death in Low-Income Countries, 2008
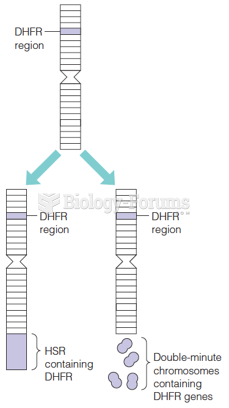 Two modes of gene amplification leading to drug resistance
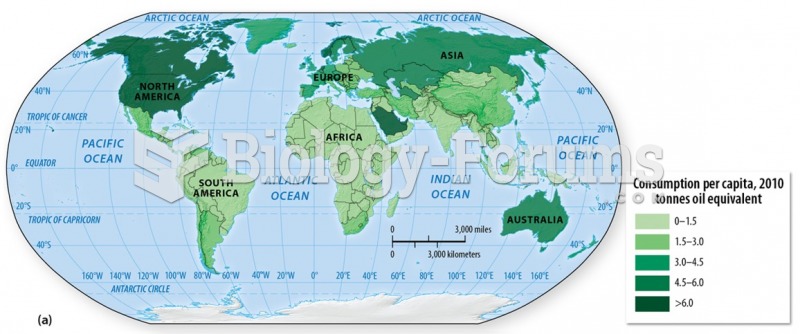 Per capita consumption of power is high in the developed world and highest in the United States
 Geymar with Kahi (Iraqi clotted cream)