|
|
|

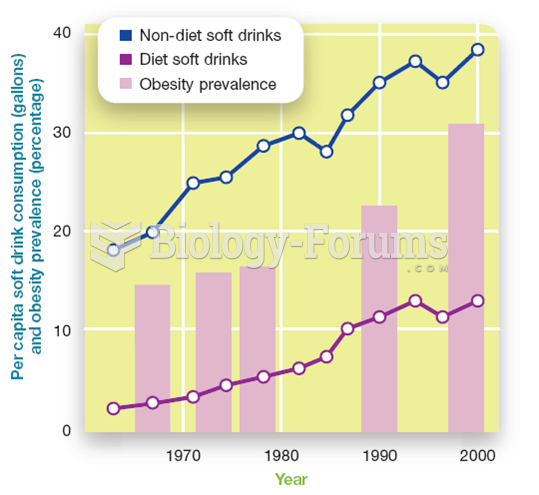 Diet Soda's Consumption's Association with Increased (not Decreased) Prevalence of ...
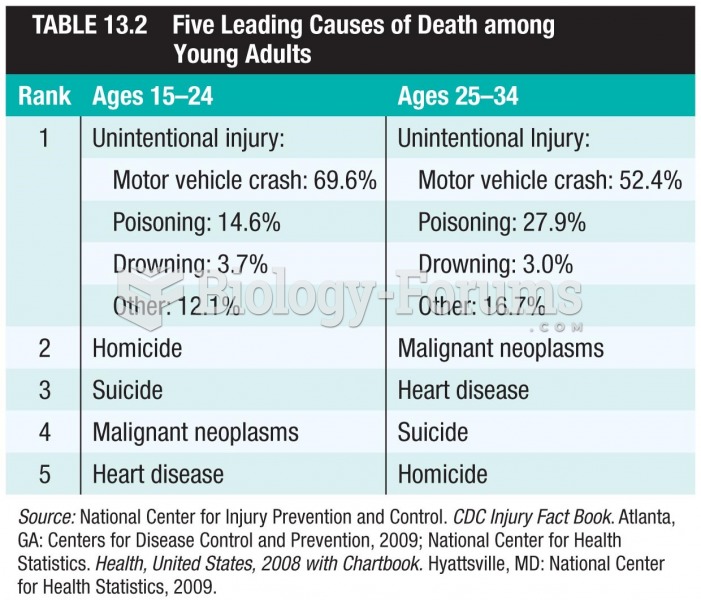 5 Leading Causes of Death among Young Adults
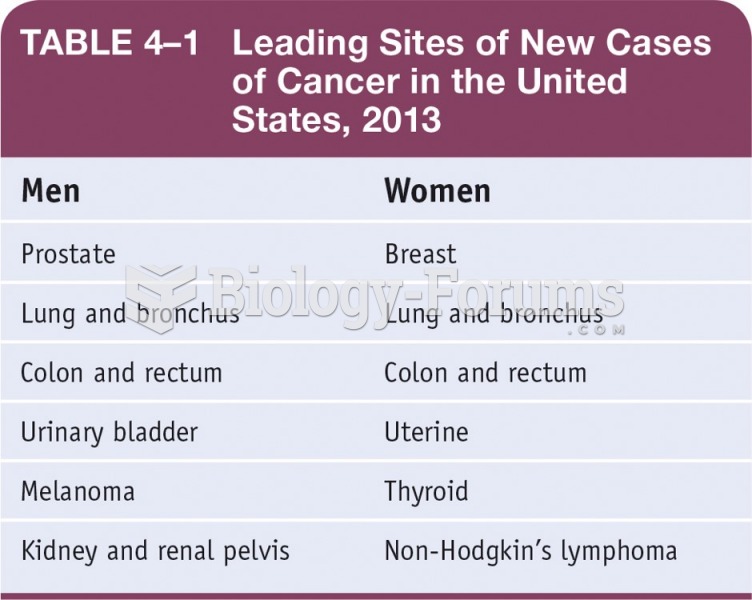 Leading Sites of New Cases of Cancer in the United States, 2013
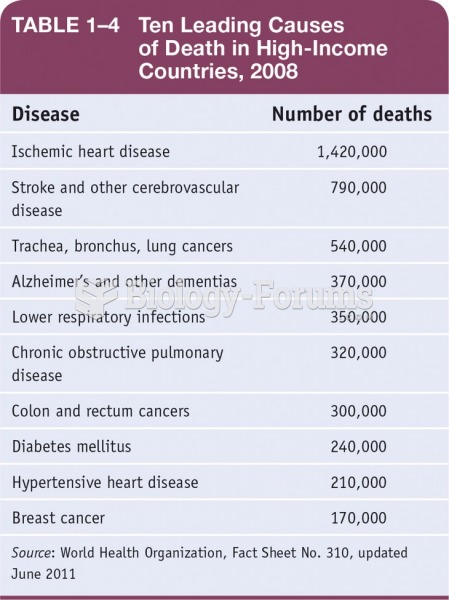 Ten Leading Causes of Death in High-Income Countries, 2008
 Mango with whipped cream
 Waffle with Vanilla Ice cream