This topic contains a solution. Click here to go to the answer
|
|
|

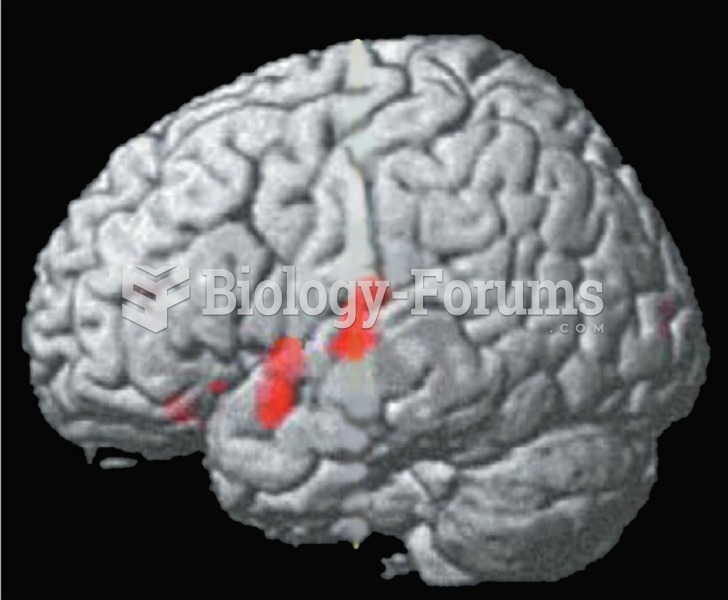 Effects of Therapy for Stuttering A functional MRI scan shows regions of the superior temporal lobe
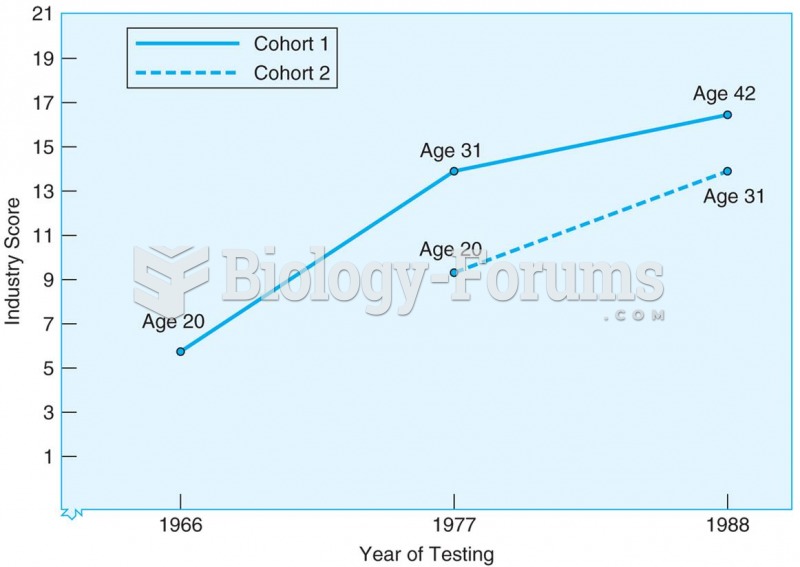 Results from sequential study of two cohorts tested at three ages and at three different points in t
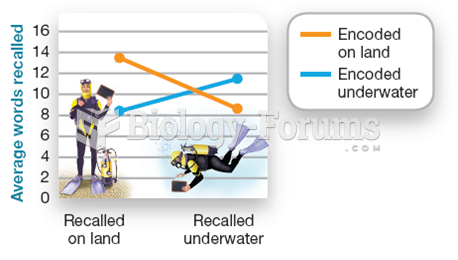 Context-Dependent Learning
 The posted octane rating in most high-altitude areas shows regular at 85 instead of the usual 87.
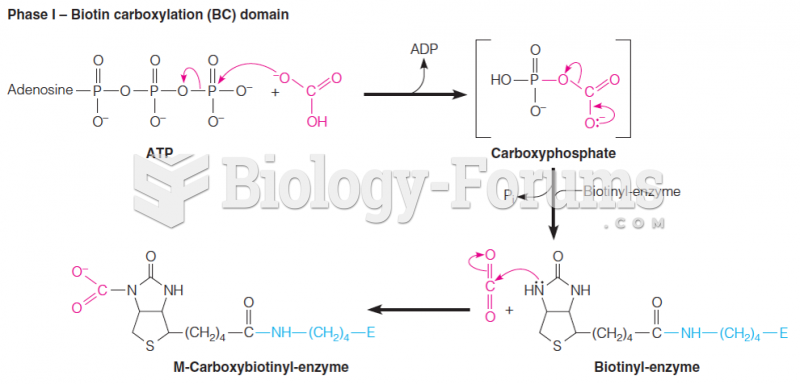 Mechanism of the biotin-dependent pyruvate carboxylase reaction Phase I
 A melting profile shows the increase in UV absorption versus temperature