This topic contains a solution. Click here to go to the answer
|
|
|

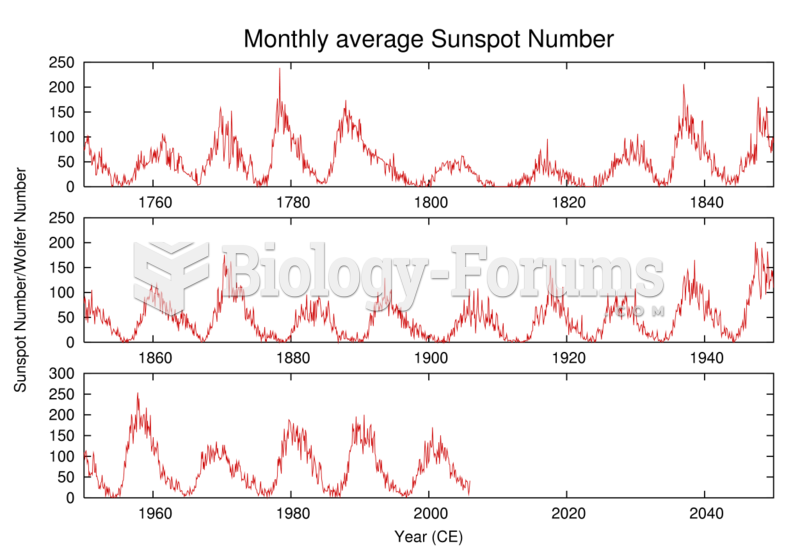 History of the number of observed sunspots during the last 250 years, which shows the ~11-year solar
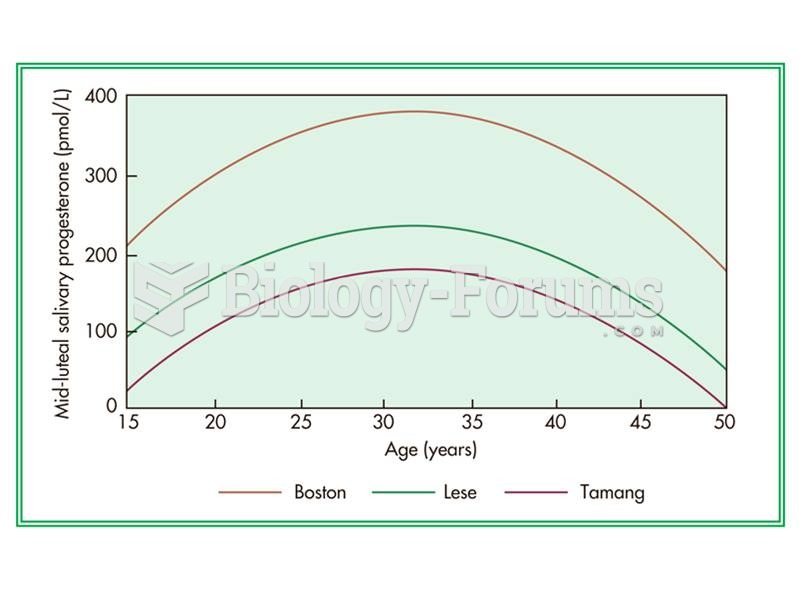 The age-dependent curve of salivary progresterone levels in three populations.
 Lewis Hine’s 1910 photograph shows a tenement alley in New York City. More famous for his “unsettlin
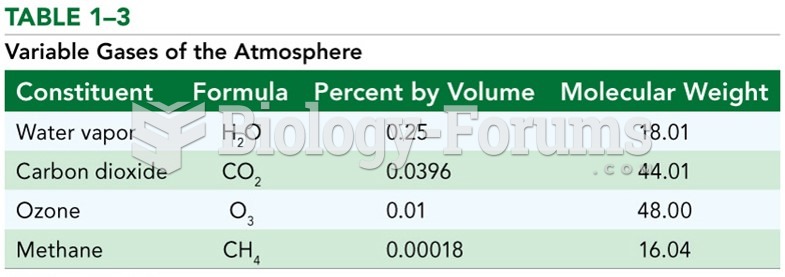 Variable Gases of the Atmosphere
 Variable Gases: Water Vapor
 Relationship between birth weight and mortality in humans