This topic contains a solution. Click here to go to the answer
|
|
|

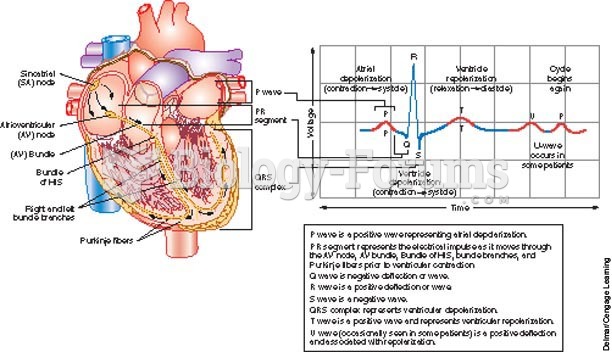 Relationship of the conduction system to an ECG strip.
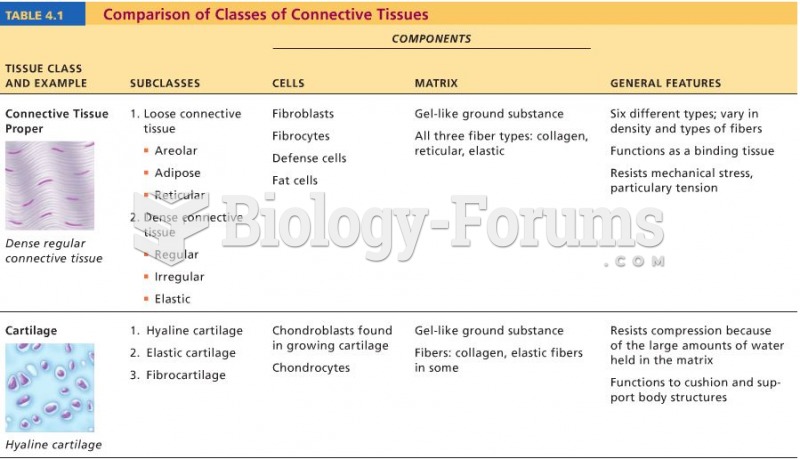 Tissue Chart
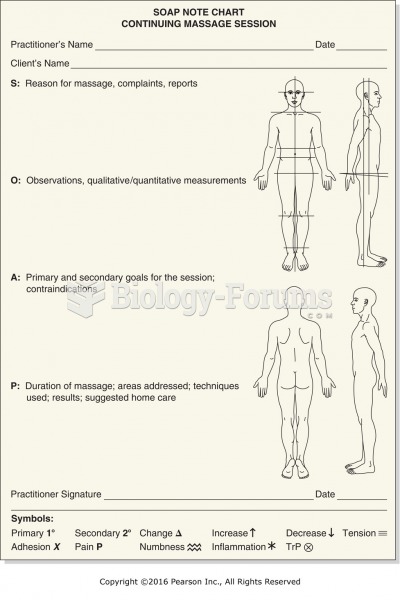 Example of SOAP chart with body diagram.
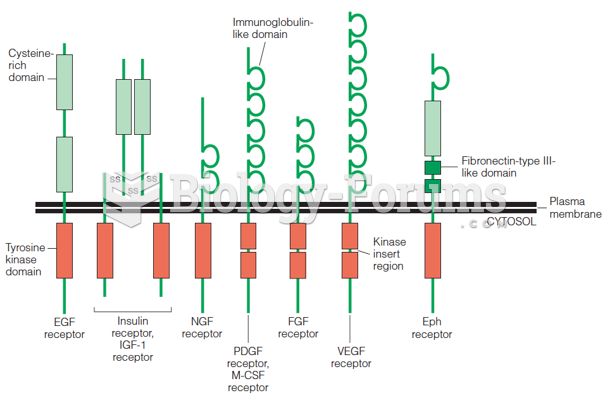 The insulin receptor and its structural relationship to other transmembrane receptors with protein
 Relationship Between Income per Capita and Population Growth
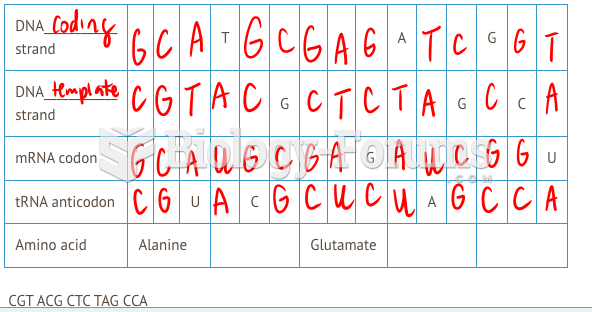 I need help fill up the chart attached phtoto long question