This topic contains a solution. Click here to go to the answer
|
|
|

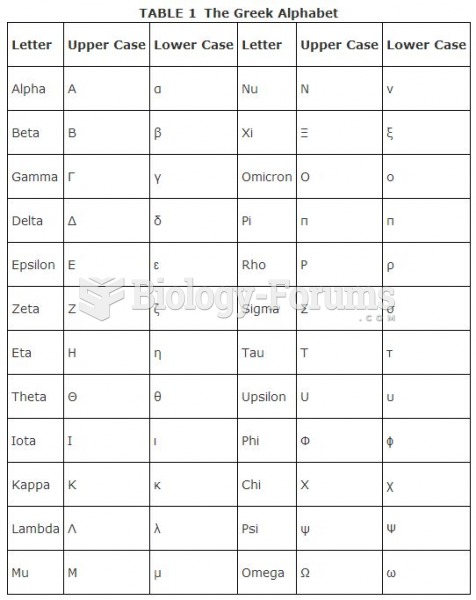 Greek Alphabet Chart
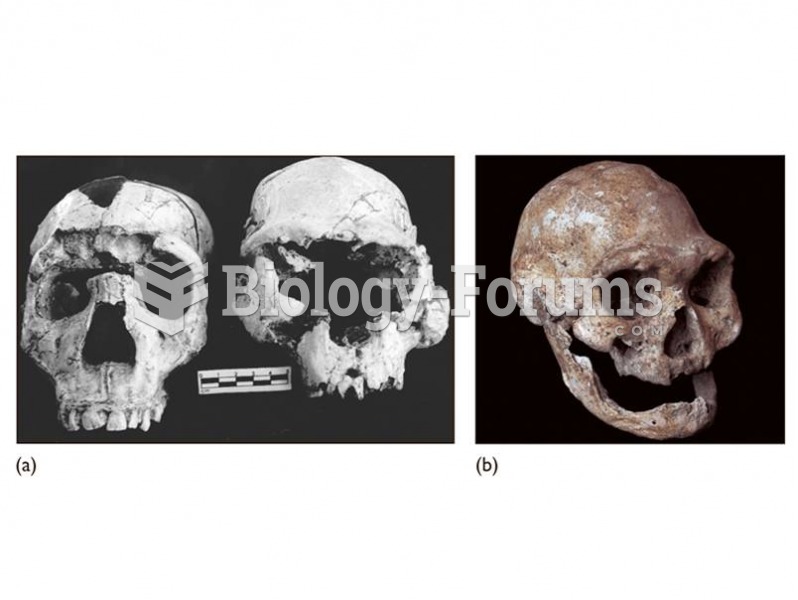 (a) The Dmanisi cranium (right) shows similarities to early African H. erectus including the Narioko
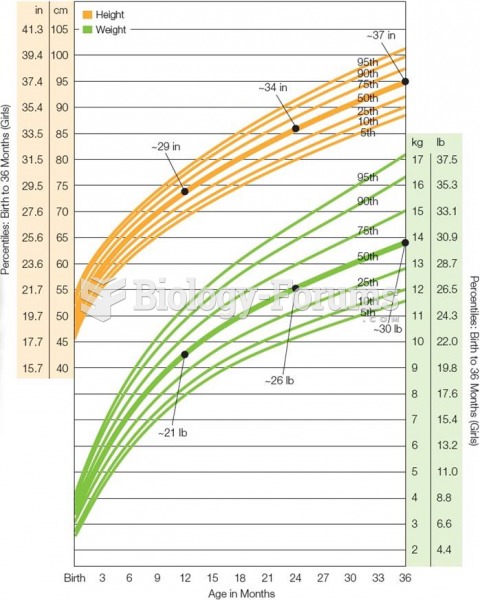 Growth Chart for American Girls From Birth Through Age 3 Growth slows from infancy to toddlerhood b
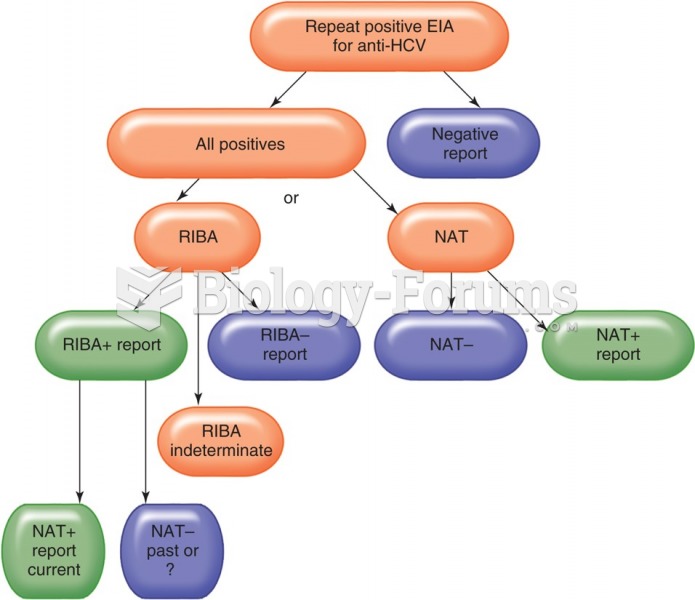 Flow chart for the diagnosis of hepatitis C. Hepatitis C reporting not using the signal-to-cutoff ...
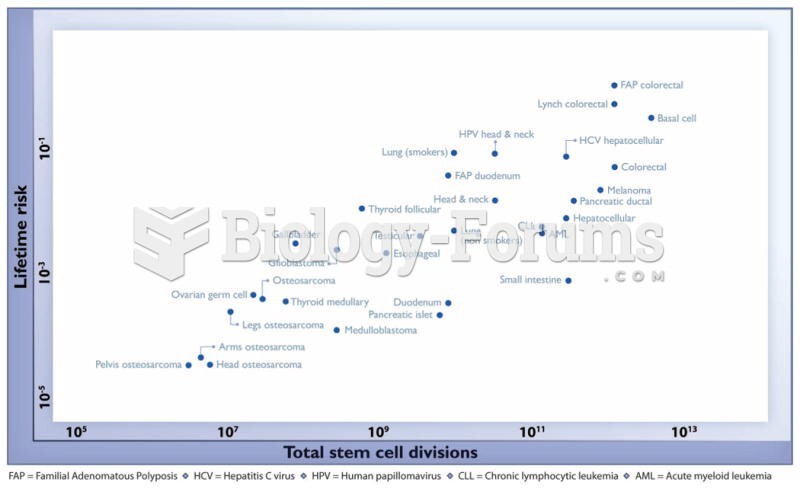 The relationship between the number of stem cell divisions in the lifetime of a given tissue and the
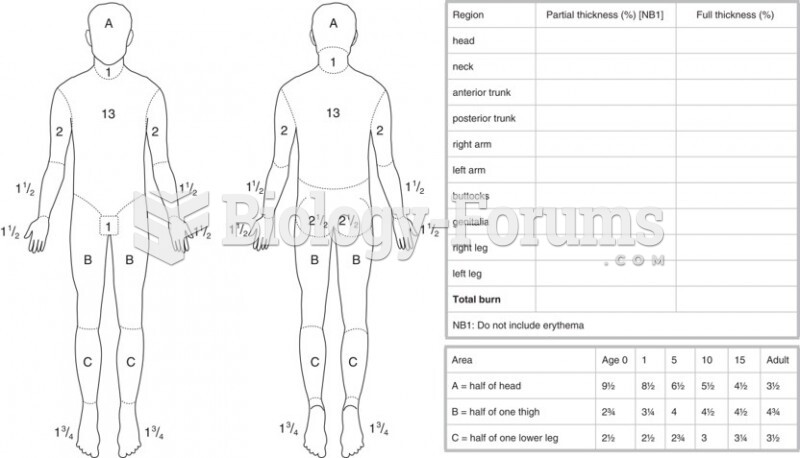 The Lund and Browder Chart