This topic contains a solution. Click here to go to the answer
|
|
|

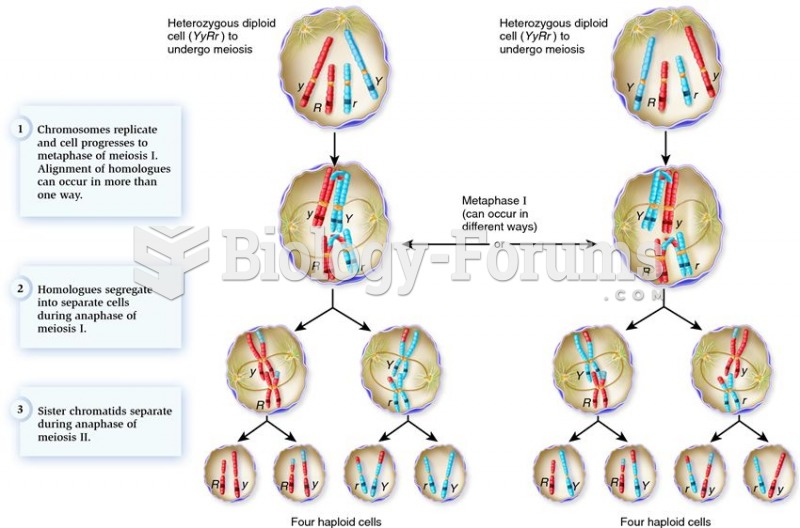 The chromosomal basis of independent assortment.
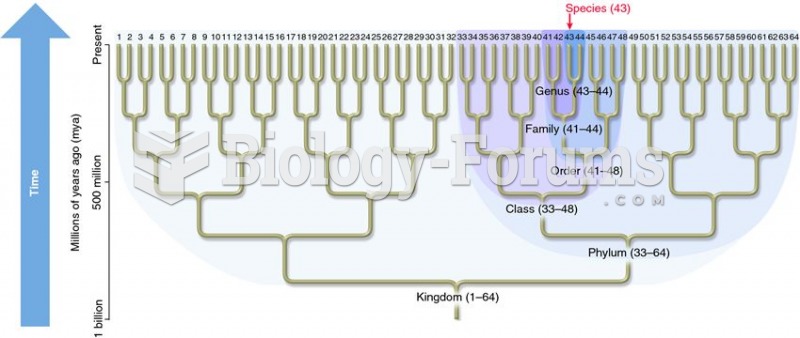 Schematic relationship between a phylogenetic tree and taxonomy.
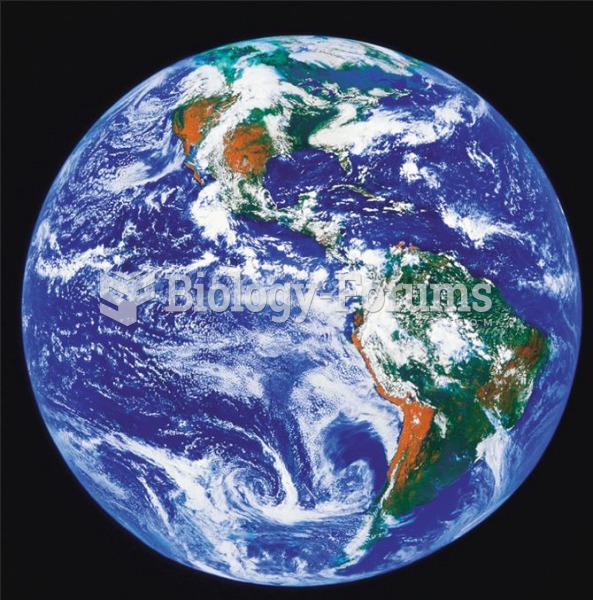 From space earth shows itself as a planet covered mostly by water.
 Betelgeuse is a semiregular variable star
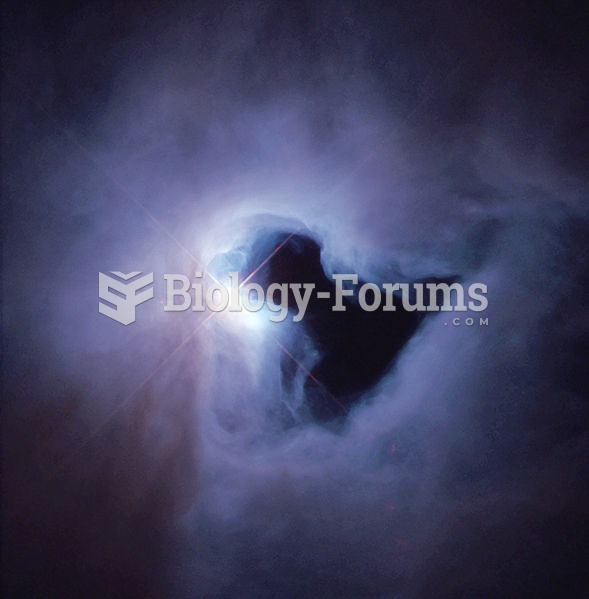 The reflection nebula NGC 1999 is brilliantly illuminated by V380 Orionis (center), a variable star
 The b-galactosdase chart