|
|
|

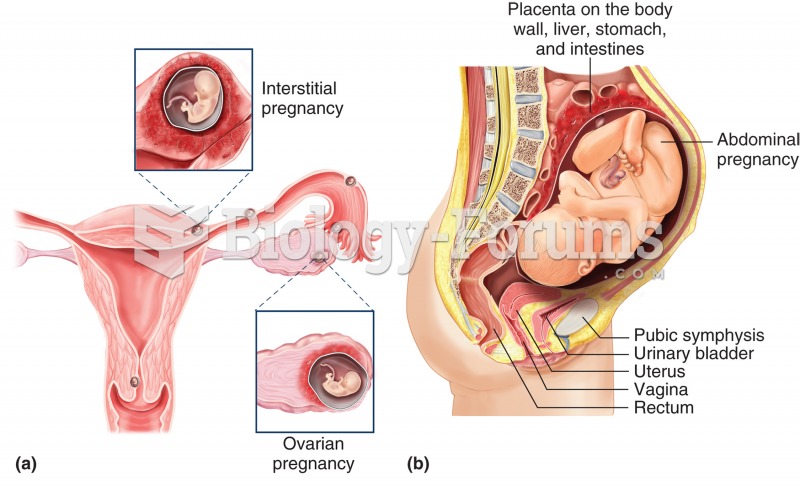 Ectopic pregnancies. (a) An ectopic pregnancy may occur in any of the locations shown. Interstitial
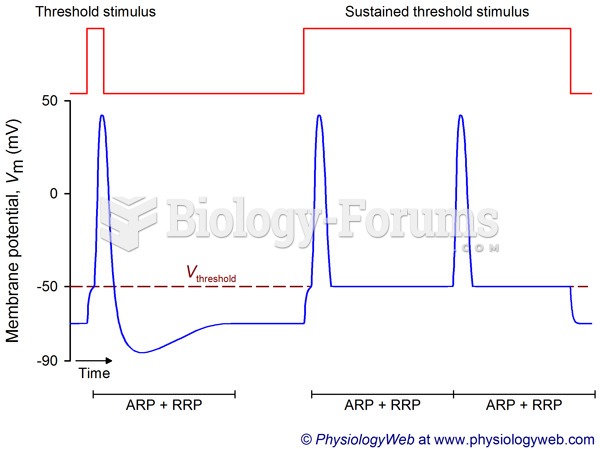 Frequency coding in the nervous system: Threshold stimulus.
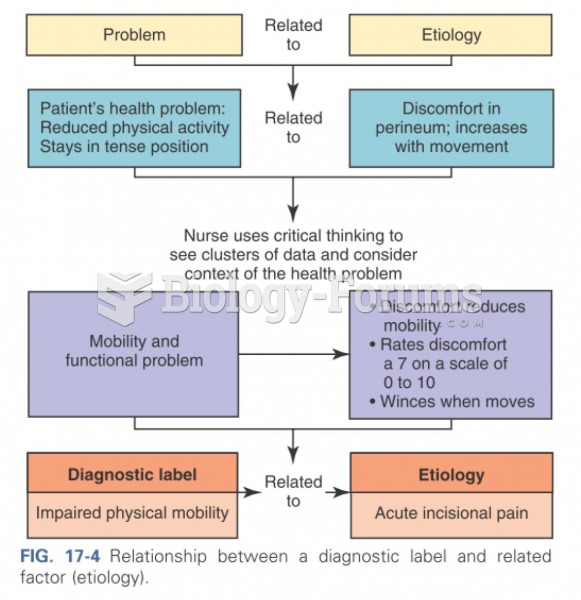 Relationship between a diagnostic label and related factor
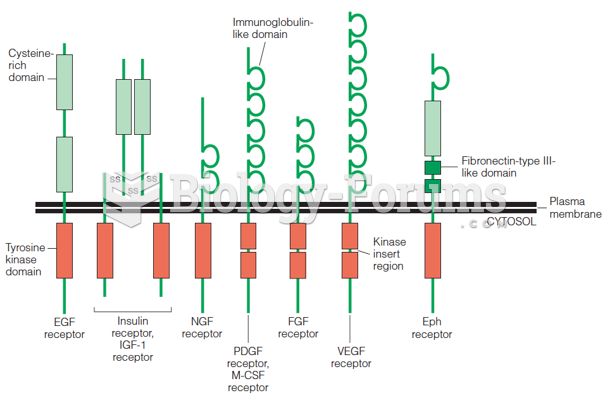 The insulin receptor and its structural relationship to other transmembrane receptors with protein
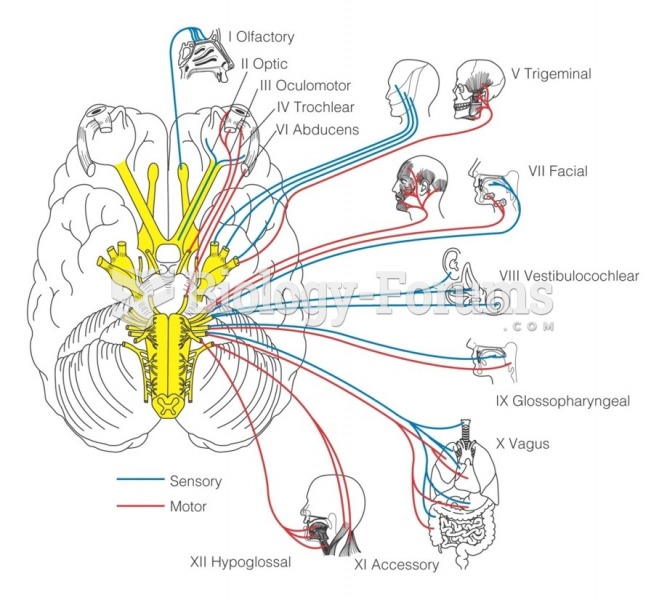 Cranial nerves and their target regions. (Sensory nerves are shown in blue; motor nerves, in red.)
 Planet Z-34 has a mass equal to 1/3 that of Earth, a radius equal to 1/3 that of Earth, and an ...