|
|
|

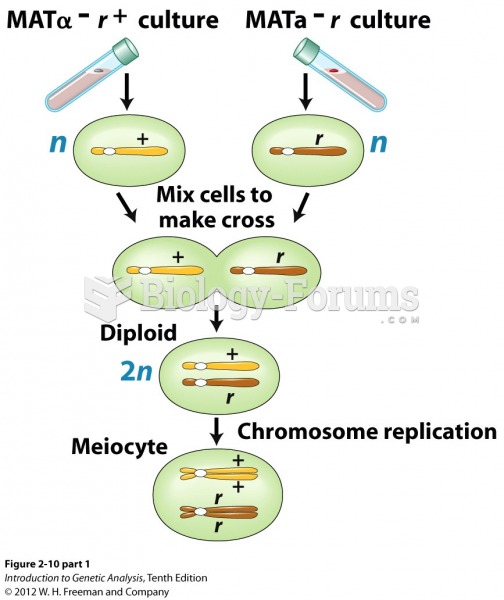 Demonstration of equal segregation within one meiocyte in the yeast S. cerevisiae
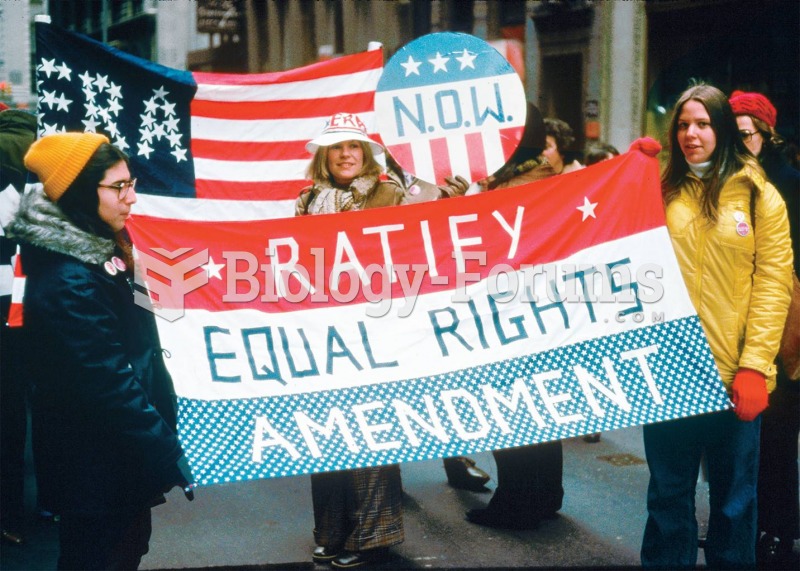 The National Organization for Women holds a rally in Illinois for the Equal Rights Amendment. In ...
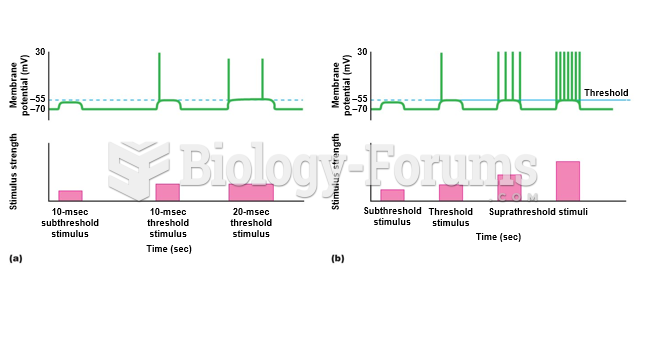 Frequency coding: how action potentials convey intensity of stimuli.
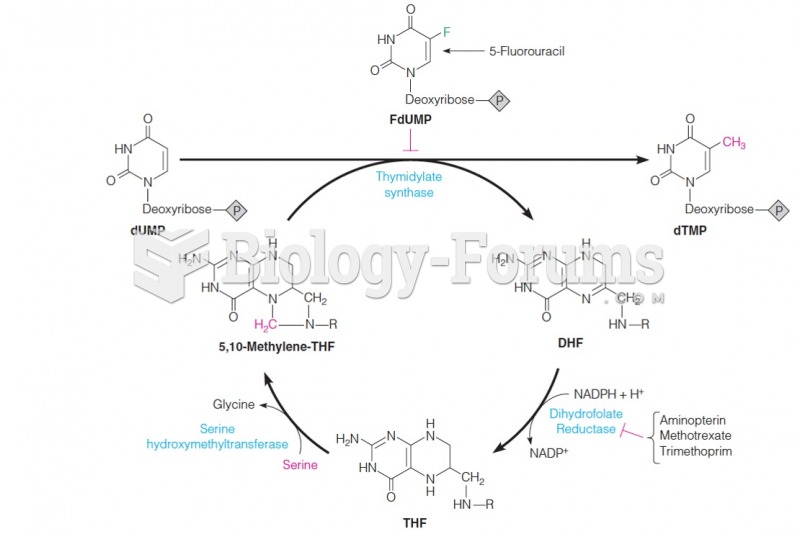 Relationship between thymidylate synthase and enzymes of tetrahydrofolate metabolism
 Infant and Toddler Development and Responsive Program Planning: A Relationship-Based Approach
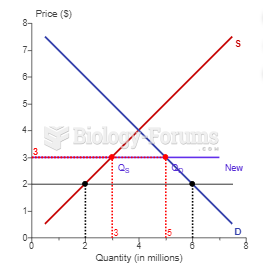 Suppose a country imports televisions. The country's supply and demand curves are shown in ...